Introduction to Stata 8 - (GRIPS
Introduction to Stata 8 - (GRIPS
Introduction to Stata 8 - (GRIPS

You also want an ePaper? Increase the reach of your titles
YUMPU automatically turns print PDFs into web optimized ePapers that Google loves.
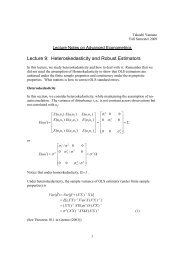
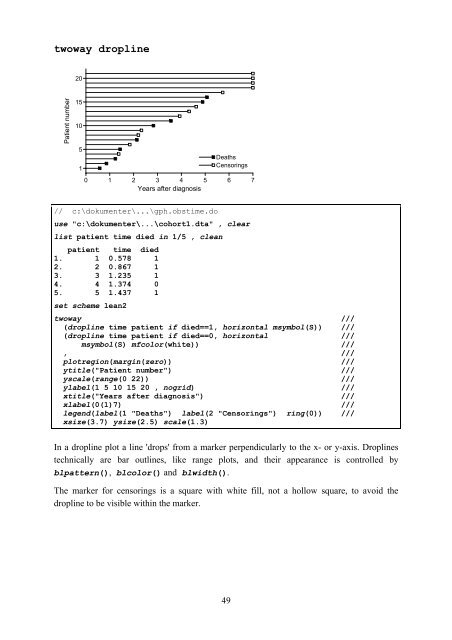
twoway dropline<br />
Patient number<br />
20<br />
15<br />
10<br />
5<br />
1<br />
Deaths<br />
Censorings<br />
0 1 2 3 4 5 6 7<br />
Years after diagnosis<br />
/ / c:\dokumenter\...\gph.obstime.do<br />
use<br />
"c:\dokumenter\...\cohort1.dta" , clear<br />
list patient time died in 1/5 , clean<br />
patient time died<br />
1. 1 0.578 1<br />
2. 2 0.867 1<br />
3. 3 1.235 1<br />
4. 4 1.374 0<br />
5.<br />
5 1.437 1<br />
set scheme lean2<br />
twoway ///<br />
(dropline time patient if died==1, horizontal msymbol(S)) ///<br />
(dropline time patient if died==0, horizontal ///<br />
msymbol(S) mfcolor(white)) ///<br />
, ///<br />
plotregion(margin(zero)) ///<br />
ytitle("Patient number") ///<br />
yscale(range(0 22)) ///<br />
ylabel(1 5 10 15 20 , nogrid) ///<br />
xtitle("Years after diagnosis") ///<br />
xlabel(0(1)7) ///<br />
legend(label(1 "Deaths") label(2 "Censorings") ring(0)) ///<br />
xsize(3.7) ysize(2.5) scale(1.3)<br />
In a dropline plot a line 'drops' from a marker perpendicularly <strong>to</strong> the x- or y-axis. Droplines<br />
technically are bar outlines, like range plots, and their appearance is controlled by<br />
blpattern(), blcolor() and blwidth().<br />
The marker for censorings is a square with white fill, not a hollow square, <strong>to</strong> avoid the<br />
dropline <strong>to</strong> be visible within the marker.<br />
49