Introduction to Stata 8 - (GRIPS
Introduction to Stata 8 - (GRIPS
Introduction to Stata 8 - (GRIPS

You also want an ePaper? Increase the reach of your titles
YUMPU automatically turns print PDFs into web optimized ePapers that Google loves.
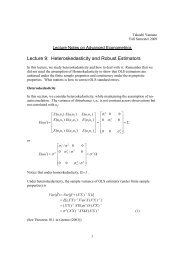
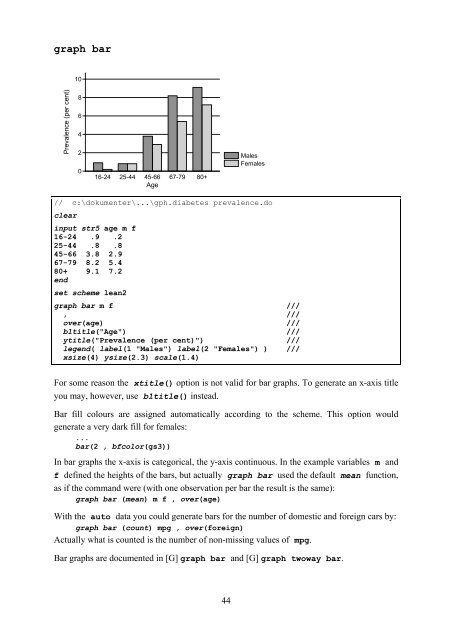
graph bar<br />
Prevalence (per cent)<br />
10<br />
8<br />
6<br />
4<br />
2<br />
0<br />
16-24 25-44 45-66 67-79 80+<br />
Age<br />
Males<br />
Females<br />
/ / c:\dokumenter\...\gph.diabetes prevalence.do<br />
clear<br />
input str5 age m f<br />
16-24 .9 .2<br />
25-44 .8 .8<br />
45-66 3.8 2.9<br />
67-79 8.2 5.4<br />
80+ 9.1 7.2<br />
end<br />
set<br />
scheme lean2<br />
graph bar m f ///<br />
, ///<br />
over(age) ///<br />
b1title("Age") ///<br />
ytitle("Prevalence (per cent)") ///<br />
legend( label(1 "Males") label(2 "Females") ) ///<br />
xsize(4) ysize(2.3) scale(1.4)<br />
For some reason the xtitle() option is not valid for bar graphs. To generate an x-axis title<br />
you may, however, use b1title() instead.<br />
Bar fill colours are assigned au<strong>to</strong>matically according <strong>to</strong> the scheme. This option would<br />
generate a very dark fill for females:<br />
...<br />
bar(2 , bfcolor(gs3))<br />
In bar graphs the x-axis is categorical, the y-axis continuous. In the example variables m and<br />
f defined the heights of the bars, but actually graph bar used the default mean function,<br />
as if the command were (with one observation per bar the result is the same):<br />
graph bar (mean) m f , over(age)<br />
With the au<strong>to</strong> data you could generate bars for the number of domestic and foreign cars by:<br />
graph bar (count) mpg , over(foreign)<br />
Actually what is counted is the number of non-missing values of mpg.<br />
Bar graphs are documented in [G] graph bar and [G] graph twoway bar.<br />
44