Introduction to Stata 8 - (GRIPS
Introduction to Stata 8 - (GRIPS
Introduction to Stata 8 - (GRIPS
You also want an ePaper? Increase the reach of your titles
YUMPU automatically turns print PDFs into web optimized ePapers that Google loves.
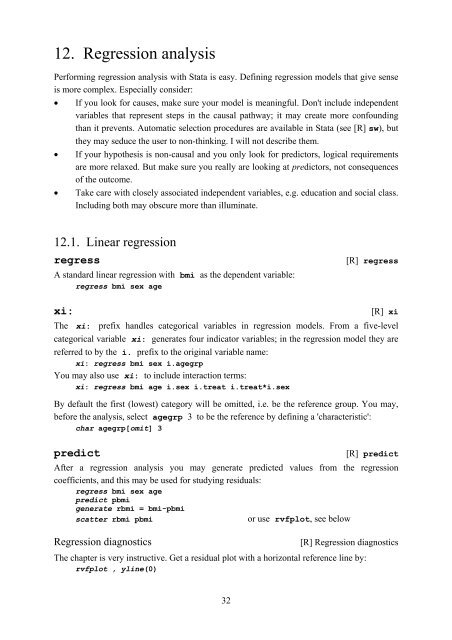
12. Regression analysis<br />
Performing regression analysis with <strong>Stata</strong> is easy. Defining regression models that give sense<br />
is more complex. Especially consider:<br />
• If you look for causes, make sure your model is meaningful. Don't include independent<br />
variables that represent steps in the causal pathway; it may create more confounding<br />
than it prevents. Au<strong>to</strong>matic selection procedures are available in <strong>Stata</strong> (see [R] sw), but<br />
they may seduce the user <strong>to</strong> non-thinking. I will not describe them.<br />
• If your hypothesis is non-causal and you only look for predic<strong>to</strong>rs, logical requirements<br />
are more relaxed. But make sure you really are looking at predic<strong>to</strong>rs, not consequences<br />
of the outcome.<br />
• Take care with closely associated independent variables, e.g. education and social class.<br />
Including both may obscure more than illuminate.<br />
12.1. Linear regression<br />
regress [R] regress<br />
A standard linear regression with bmi as the dependent variable:<br />
regress bmi sex age<br />
xi: [R] xi<br />
The xi: prefix handles categorical variables in regression models. From a five-level<br />
categorical variable xi: generates four indica<strong>to</strong>r variables; in the regression model they are<br />
referred <strong>to</strong> by the i. prefix <strong>to</strong> the original variable name:<br />
xi: regress bmi sex i.agegrp<br />
You may also use xi: <strong>to</strong> include interaction terms:<br />
xi: regress bmi age i.sex i.treat i.treat*i.sex<br />
By default the first (lowest) category will be omitted, i.e. be the reference group. You may,<br />
before the analysis, select agegrp 3 <strong>to</strong> be the reference by defining a 'characteristic':<br />
char agegrp[omit] 3<br />
predict [R] predict<br />
After a regression analysis you may generate predicted values from the regression<br />
coefficients, and this may be used for studying residuals:<br />
regress bmi sex age<br />
predict pbmi<br />
generate rbmi = bmi-pbmi<br />
scatter rbmi pbmi or use rvfplot, see below<br />
Regression diagnostics [R] Regression diagnostics<br />
The chapter is very instructive. Get a residual plot with a horizontal reference line by:<br />
rvfplot , yline(0)<br />
32


