Introduction to Stata 8 - (GRIPS
Introduction to Stata 8 - (GRIPS
Introduction to Stata 8 - (GRIPS
Create successful ePaper yourself
Turn your PDF publications into a flip-book with our unique Google optimized e-Paper software.
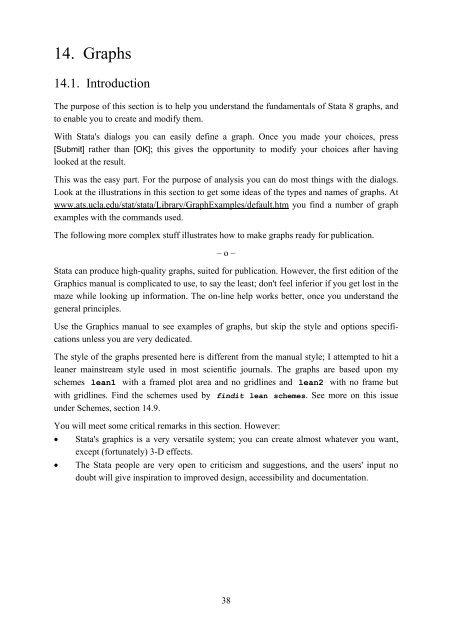
14. Graphs<br />
14.1. <strong>Introduction</strong><br />
The purpose of this section is <strong>to</strong> help you understand the fundamentals of <strong>Stata</strong> 8 graphs, and<br />
<strong>to</strong> enable you <strong>to</strong> create and modify them.<br />
With <strong>Stata</strong>'s dialogs you can easily define a graph. Once you made your choices, press<br />
[Submit] rather than [OK]; this gives the opportunity <strong>to</strong> modify your choices after having<br />
looked at the result.<br />
This was the easy part. For the purpose of analysis you can do most things with the dialogs.<br />
Look at the illustrations in this section <strong>to</strong> get some ideas of the types and names of graphs. At<br />
www.ats.ucla.edu/stat/stata/Library/GraphExamples/default.htm you find a number of graph<br />
examples with the commands used.<br />
The following more complex stuff illustrates how <strong>to</strong> make graphs ready for publication.<br />
– o –<br />
<strong>Stata</strong> can produce high-quality graphs, suited for publication. However, the first edition of the<br />
Graphics manual is complicated <strong>to</strong> use, <strong>to</strong> say the least; don't feel inferior if you get lost in the<br />
maze while looking up information. The on-line help works better, once you understand the<br />
general principles.<br />
Use the Graphics manual <strong>to</strong> see examples of graphs, but skip the style and options specifications<br />
unless you are very dedicated.<br />
The style of the graphs presented here is different from the manual style; I attempted <strong>to</strong> hit a<br />
leaner mainstream style used in most scientific journals. The graphs are based upon my<br />
schemes lean1 with a framed plot area and no gridlines and lean2 with no frame but<br />
with gridlines. Find the schemes used by findit lean schemes. See more on this issue<br />
under Schemes, section 14.9.<br />
You will meet some critical remarks in this section. However:<br />
• <strong>Stata</strong>'s graphics is a very versatile system; you can create almost whatever you want,<br />
except (fortunately) 3-D effects.<br />
• The <strong>Stata</strong> people are very open <strong>to</strong> criticism and suggestions, and the users' input no<br />
doubt will give inspiration <strong>to</strong> improved design, accessibility and documentation.<br />
38


