Introduction to Stata 8 - (GRIPS
Introduction to Stata 8 - (GRIPS
Introduction to Stata 8 - (GRIPS

You also want an ePaper? Increase the reach of your titles
YUMPU automatically turns print PDFs into web optimized ePapers that Google loves.
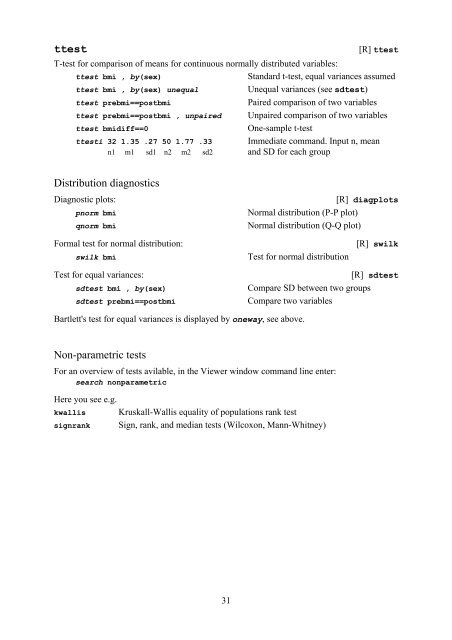
ttest [R] ttest<br />
T-test for comparison of means for continuous normally distributed variables:<br />
ttest bmi , by(sex) Standard t-test, equal variances assumed<br />
ttest bmi , by(sex) unequal Unequal variances (see sdtest)<br />
ttest prebmi==postbmi Paired comparison of two variables<br />
ttest prebmi==postbmi , unpaired Unpaired comparison of two variables<br />
ttest bmidiff==0 One-sample t-test<br />
ttesti 32 1.35 .27 50 1.77 .33 Immediate command. Input n, mean<br />
n1 m1 sd1 n2 m2 sd2 and SD for each group<br />
Distribution diagnostics<br />
Diagnostic plots: [R] diagplots<br />
pnorm bmi Normal distribution (P-P plot)<br />
qnorm bmi Normal distribution (Q-Q plot)<br />
Formal test for normal distribution: [R] swilk<br />
swilk bmi Test for normal distribution<br />
Test for equal variances: [R] sdtest<br />
sdtest bmi , by(sex) Compare SD between two groups<br />
sdtest prebmi==postbmi Compare two variables<br />
Bartlett's test for equal variances is displayed by oneway, see above.<br />
Non-parametric tests<br />
For an overview of tests avilable, in the Viewer window command line enter:<br />
search nonparametric<br />
Here you see e.g.<br />
kwallis Kruskall-Wallis equality of populations rank test<br />
signrank Sign, rank, and median tests (Wilcoxon, Mann-Whitney)<br />
31