

Donepezil, rivastigmine, galantamine and memantine for ...
Donepezil, rivastigmine, galantamine and memantine for ...
Donepezil, rivastigmine, galantamine and memantine for ...

Create successful ePaper yourself
Turn your PDF publications into a flip-book with our unique Google optimized e-Paper software.
Comparison:<br />
Outcome:<br />
Study<br />
03 <strong>Donepezil</strong>: MMSE change from baseline<br />
01 <strong>Donepezil</strong> 5 mg<br />
Treatment<br />
n<br />
Mean<br />
(SD)<br />
Control<br />
n<br />
01 at 24 weeks<br />
Rogers 1998a don<br />
Subtotal (95% CI)<br />
Test <strong>for</strong> heterogeneity 2 153 –0.24 (3.30) 154<br />
153<br />
154<br />
= 0.0, df = 0<br />
Test <strong>for</strong> overall effect z = 3.21, p = 0.001<br />
02 at 12 weeks<br />
Rogers 1998b don<br />
Subtotal (95% CI)<br />
Test <strong>for</strong> heterogeneity 2 156 1.00 (3.10) 150<br />
156<br />
150<br />
= 0.0, df = 0<br />
Test <strong>for</strong> overall effect z = 2.71, p = 0.007<br />
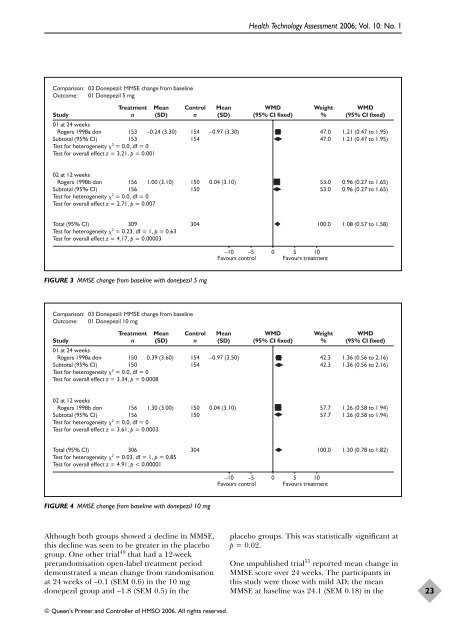
Although both groups showed a decline in MMSE,<br />
this decline was seen to be greater in the placebo<br />
group. One other trial 49 that had a 12-week<br />
prer<strong>and</strong>omisation open-label treatment period<br />
demonstrated a mean change from r<strong>and</strong>omisation<br />
at 24 weeks of –0.1 (SEM 0.6) in the 10 mg<br />
donepezil group <strong>and</strong> –1.8 (SEM 0.5) in the<br />
Mean<br />
(SD)<br />
© Queen’s Printer <strong>and</strong> Controller of HMSO 2006. All rights reserved.<br />
Health Technology Assessment 2006; Vol. 10: No. 1<br />
WMD<br />
(95% CI fixed)<br />
Weight<br />
%<br />
–0.97 (3.30) 47.0<br />
47.0<br />
0.04 (3.10) 53.0<br />
53.0<br />
WMD<br />
(95% CI fixed)<br />
1.21 (0.47 to 1.95)<br />
1.21 (0.47 to 1.95)<br />
0.96 (0.27 to 1.65)<br />
0.96 (0.27 to 1.65)<br />
Total (95% CI)<br />
Test <strong>for</strong> heterogeneity 2 309 304 100.0 1.08 (0.57 to 1.58)<br />
= 0.23, df = 1, p = 0.63<br />
Test <strong>for</strong> overall effect z = 4.17, p = 0.00003<br />
FIGURE 3 MMSE change from baseline with donepezil 5 mg<br />
Comparison:<br />
Outcome:<br />
Study<br />
03 <strong>Donepezil</strong>: MMSE change from baseline<br />
01 <strong>Donepezil</strong> 10 mg<br />
Treatment<br />
n<br />
Mean<br />
(SD)<br />
Control<br />
n<br />
01 at 24 weeks<br />
Rogers 1998a don<br />
Subtotal (95% CI)<br />
Test <strong>for</strong> heterogeneity 2 150 0.39 (3.60) 154<br />
150<br />
154<br />
= 0.0, df = 0<br />
Test <strong>for</strong> overall effect z = 3.34, p = 0.0008<br />
02 at 12 weeks<br />
Rogers 1998b don<br />
Subtotal (95% CI)<br />
Test <strong>for</strong> heterogeneity 2 156 1.30 (3.00) 150<br />
156<br />
150<br />
= 0.0, df = 0<br />
Test <strong>for</strong> overall effect z = 3.61, p = 0.0003<br />
–10 –5 0 5 10<br />
Favours control Favours treatment<br />
–0.97 (3.50) 42.3<br />
42.3<br />
0.04 (3.10) 57.7<br />
57.7<br />
1.36 (0.56 to 2.16)<br />
1.36 (0.56 to 2.16)<br />
1.26 (0.58 to 1.94)<br />
1.26 (0.58 to 1.94)<br />
Total (95% CI)<br />
Test <strong>for</strong> heterogeneity 2 306 304 100.0 1.30 (0.78 to 1.82)<br />
= 0.03, df = 1, p = 0.85<br />
Test <strong>for</strong> overall effect z = 4.91, p < 0.00001<br />
FIGURE 4 MMSE change from baseline with donepezil 10 mg<br />
Mean<br />
(SD)<br />
WMD<br />
(95% CI fixed)<br />
Weight<br />
%<br />
–10 –5 0 5 10<br />
Favours control Favours treatment<br />
WMD<br />
(95% CI fixed)<br />
placebo groups. This was statistically significant at<br />
p = 0.02.<br />
One unpublished trial 55 reported mean change in<br />
MMSE score over 24 weeks. The participants in<br />
this study were those with mild AD; the mean<br />
MMSE at baseline was 24.1 (SEM 0.18) in the<br />
23


