

Donepezil, rivastigmine, galantamine and memantine for ...
Donepezil, rivastigmine, galantamine and memantine for ...
Donepezil, rivastigmine, galantamine and memantine for ...

You also want an ePaper? Increase the reach of your titles
YUMPU automatically turns print PDFs into web optimized ePapers that Google loves.
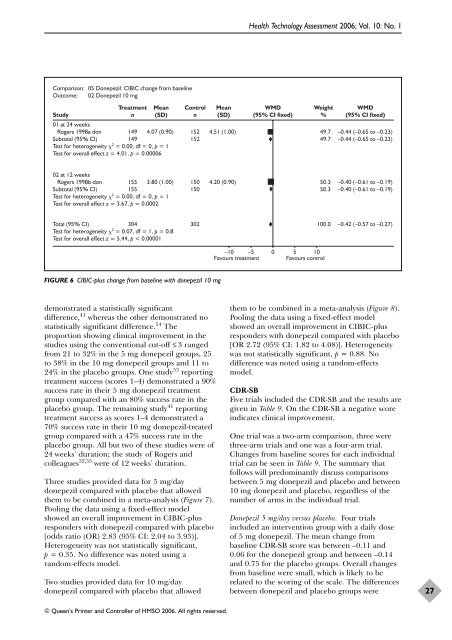
Comparison:<br />
Outcome:<br />
Study<br />
05 <strong>Donepezil</strong>: CIBIC change from baseline<br />
02 <strong>Donepezil</strong> 10 mg<br />
Treatment<br />
n<br />
Mean<br />
(SD)<br />
Control<br />
n<br />
01 at 24 weeks<br />
Rogers 1998a don<br />
Subtotal (95% CI)<br />
Test <strong>for</strong> heterogeneity 2 149 4.07 (0.90) 152<br />
149<br />
152<br />
= 0.00, df = 0, p = 1<br />
Test <strong>for</strong> overall effect z = 4.01, p = 0.00006<br />
02 at 12 weeks<br />
Rogers 1998b don<br />
Subtotal (95% CI)<br />
Test <strong>for</strong> heterogeneity 2 155 3.80 (1.00) 150<br />
155<br />
150<br />
= 0.00, df = 0, p = 1<br />
Test <strong>for</strong> overall effect z = 3.67, p = 0.0002<br />
demonstrated a statistically significant<br />
difference, 41 whereas the other demonstrated no<br />
statistically significant difference. 54 The<br />
proportion showing clinical improvement in the<br />
studies using the conventional cut-off ≤ 3 ranged<br />
from 21 to 32% in the 5 mg donepezil groups, 25<br />
to 38% in the 10 mg donepezil groups <strong>and</strong> 11 to<br />
24% in the placebo groups. One study 53 reporting<br />
treatment success (scores 1–4) demonstrated a 90%<br />
success rate in their 5 mg donepezil treatment<br />
group compared with an 80% success rate in the<br />
placebo group. The remaining study 41 reporting<br />
treatment success as scores 1–4 demonstrated a<br />
70% success rate in their 10 mg donepezil-treated<br />
group compared with a 47% success rate in the<br />
placebo group. All but two of these studies were of<br />
24 weeks’ duration; the study of Rogers <strong>and</strong><br />
colleagues 52,53 were of 12 weeks’ duration.<br />
Three studies provided data <strong>for</strong> 5 mg/day<br />
donepezil compared with placebo that allowed<br />
them to be combined in a meta-analysis (Figure 7).<br />
Pooling the data using a fixed-effect model<br />
showed an overall improvement in CIBIC-plus<br />
responders with donepezil compared with placebo<br />
[odds ratio (OR) 2.83 (95% CI: 2.04 to 3.93)].<br />
Heterogeneity was not statistically significant,<br />
p = 0.35. No difference was noted using a<br />
r<strong>and</strong>om-effects model.<br />
Two studies provided data <strong>for</strong> 10 mg/day<br />
donepezil compared with placebo that allowed<br />
© Queen’s Printer <strong>and</strong> Controller of HMSO 2006. All rights reserved.<br />
Health Technology Assessment 2006; Vol. 10: No. 1<br />
4.51 (1.00) 49.7<br />
49.7<br />
4.20 (0.90) 50.3<br />
50.3<br />
–0.44 (–0.65 to –0.23)<br />
–0.44 (–0.65 to –0.23)<br />
–0.40 (–0.61 to –0.19)<br />
–0.40 (–0.61 to –0.19)<br />
Total (95% CI)<br />
Test <strong>for</strong> heterogeneity 2 304 302 100.0 –0.42 (–0.57 to –0.27)<br />
= 0.07, df = 1, p = 0.8<br />
Test <strong>for</strong> overall effect z = 5.44, p < 0.00001<br />
FIGURE 6 CIBIC-plus change from baseline with donepezil 10 mg<br />
Mean<br />
(SD)<br />
WMD<br />
(95% CI fixed)<br />
Weight<br />
%<br />
–10 –5 0 5 10<br />
Favours treatment Favours control<br />
WMD<br />
(95% CI fixed)<br />
them to be combined in a meta-analysis (Figure 8).<br />
Pooling the data using a fixed-effect model<br />
showed an overall improvement in CIBIC-plus<br />
responders with donepezil compared with placebo<br />
[OR 2.72 (95% CI: 1.82 to 4.08)]. Heterogeneity<br />
was not statistically significant, p = 0.88. No<br />
difference was noted using a r<strong>and</strong>om-effects<br />
model.<br />
CDR-SB<br />
Five trials included the CDR-SB <strong>and</strong> the results are<br />
given in Table 9. On the CDR-SB a negative score<br />
indicates clinical improvement.<br />
One trial was a two-arm comparison, three were<br />
three-arm trials <strong>and</strong> one was a four-arm trial.<br />
Changes from baseline scores <strong>for</strong> each individual<br />
trial can be seen in Table 9. The summary that<br />
follows will predominantly discuss comparisons<br />
between 5 mg donepezil <strong>and</strong> placebo <strong>and</strong> between<br />
10 mg donepezil <strong>and</strong> placebo, regardless of the<br />
number of arms in the individual trial.<br />
<strong>Donepezil</strong> 5 mg/day versus placebo. Four trials<br />
included an intervention group with a daily dose<br />
of 5 mg donepezil. The mean change from<br />
baseline CDR-SB score was between –0.11 <strong>and</strong><br />
0.06 <strong>for</strong> the donepezil group <strong>and</strong> between –0.14<br />
<strong>and</strong> 0.75 <strong>for</strong> the placebo groups. Overall changes<br />
from baseline were small, which is likely to be<br />
related to the scoring of the scale. The differences<br />
between donepezil <strong>and</strong> placebo groups were<br />
27


