

Donepezil, rivastigmine, galantamine and memantine for ...
Donepezil, rivastigmine, galantamine and memantine for ...
Donepezil, rivastigmine, galantamine and memantine for ...

Create successful ePaper yourself
Turn your PDF publications into a flip-book with our unique Google optimized e-Paper software.
Three trials 41,44,54 were two-arm comparisons,<br />
three were three-arm comparisons 50–52 <strong>and</strong> one<br />
was a four-arm comparison. 53 Change from<br />
baseline scores <strong>for</strong> each individual trial can be<br />
seen in Tables 7 <strong>and</strong> 8. The summary that follows<br />
will predominantly discuss comparisons between<br />
5 mg donepezil <strong>and</strong> placebo <strong>and</strong> 10 mg donepezil<br />
<strong>and</strong> placebo, regardless of the number of arms in<br />
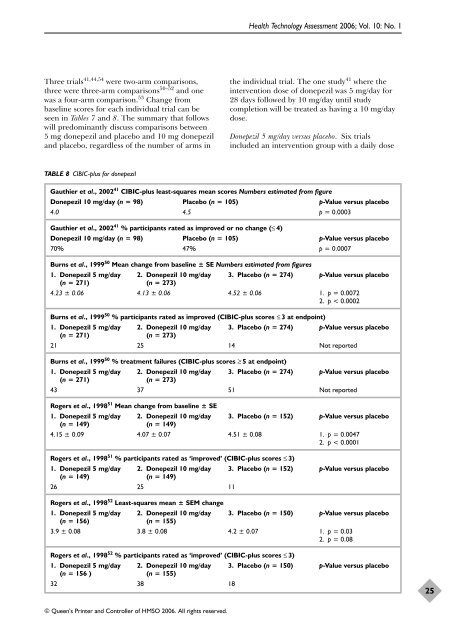
TABLE 8 CIBIC-plus <strong>for</strong> donepezil<br />
© Queen’s Printer <strong>and</strong> Controller of HMSO 2006. All rights reserved.<br />
Health Technology Assessment 2006; Vol. 10: No. 1<br />
the individual trial. The one study 41 where the<br />
intervention dose of donepezil was 5 mg/day <strong>for</strong><br />
28 days followed by 10 mg/day until study<br />
completion will be treated as having a 10 mg/day<br />
dose.<br />
<strong>Donepezil</strong> 5 mg/day versus placebo. Six trials<br />
included an intervention group with a daily dose<br />
Gauthier et al., 200241 CIBIC-plus least-squares mean scores Numbers estimated from figure<br />
<strong>Donepezil</strong> 10 mg/day (n = 98) Placebo (n = 105) p-Value versus placebo<br />
4.0 4.5 p = 0.0003<br />
Gauthier et al., 200241 % participants rated as improved or no change (≤ 4)<br />
<strong>Donepezil</strong> 10 mg/day (n = 98) Placebo (n = 105) p-Value versus placebo<br />
70% 47% p = 0.0007<br />
Burns et al., 199950 Mean change from baseline ± SE Numbers estimated from figures<br />
1. <strong>Donepezil</strong> 5 mg/day 2. <strong>Donepezil</strong> 10 mg/day 3. Placebo (n = 274) p-Value versus placebo<br />
(n = 271) (n = 273)<br />
4.23 ± 0.06 4.13 ± 0.06 4.52 ± 0.06 1. p = 0.0072<br />
2. p < 0.0002<br />
Burns et al., 199950 % participants rated as improved (CIBIC-plus scores ≤ 3 at endpoint)<br />
1. <strong>Donepezil</strong> 5 mg/day 2. <strong>Donepezil</strong> 10 mg/day 3. Placebo (n = 274) p-Value versus placebo<br />
(n = 271) (n = 273)<br />
21 25 14 Not reported<br />
Burns et al., 199950 % treatment failures (CIBIC-plus scores ≥ 5 at endpoint)<br />
1. <strong>Donepezil</strong> 5 mg/day 2. <strong>Donepezil</strong> 10 mg/day 3. Placebo (n = 274) p-Value versus placebo<br />
(n = 271) (n = 273)<br />
43 37 51 Not reported<br />
Rogers et al., 199851 Mean change from baseline ± SE<br />
1. <strong>Donepezil</strong> 5 mg/day 2. <strong>Donepezil</strong> 10 mg/day 3. Placebo (n = 152) p-Value versus placebo<br />
(n = 149) (n = 149)<br />
4.15 ± 0.09 4.07 ± 0.07 4.51 ± 0.08 1. p = 0.0047<br />
2. p < 0.0001<br />
Rogers et al., 199851 % participants rated as ‘improved’ (CIBIC-plus scores ≤ 3)<br />
1. <strong>Donepezil</strong> 5 mg/day 2. <strong>Donepezil</strong> 10 mg/day 3. Placebo (n = 152) p-Value versus placebo<br />
(n = 149) (n = 149)<br />
26 25 11<br />
Rogers et al., 199852 Least-squares mean ± SEM change<br />
1. <strong>Donepezil</strong> 5 mg/day 2. <strong>Donepezil</strong> 10 mg/day 3. Placebo (n = 150) p-Value versus placebo<br />
(n = 156) (n = 155)<br />
3.9 ± 0.08 3.8 ± 0.08 4.2 ± 0.07 1. p = 0.03<br />
2. p = 0.08<br />
Rogers et al., 199852 % participants rated as ‘improved’ (CIBIC-plus scores ≤ 3)<br />
1. <strong>Donepezil</strong> 5 mg/day 2. <strong>Donepezil</strong> 10 mg/day 3. Placebo (n = 150) p-Value versus placebo<br />
(n = 156 ) (n = 155)<br />
32 38 18<br />
25


