1999 Annual Report - Delta Electronics
1999 Annual Report - Delta Electronics
1999 Annual Report - Delta Electronics

Create successful ePaper yourself
Turn your PDF publications into a flip-book with our unique Google optimized e-Paper software.
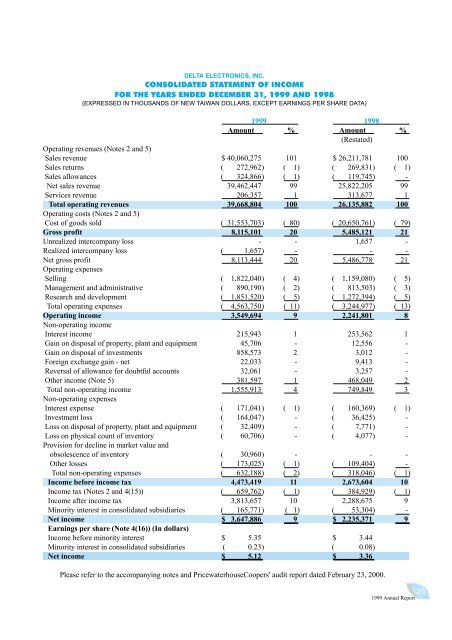
DELTA ELECTRONICS, INC.<br />
CONSOLIDATED STATEMENT OF INCOME<br />
FOR THE YEARS ENDED DECEMBER 31, <strong>1999</strong> AND 1998<br />
(EXPRESSED IN THOUSANDS OF NEW TAIWAN DOLLARS, EXCEPT EARNINGS PER SHARE DATA)<br />
<strong>1999</strong> 1998<br />
Amount % Amount<br />
(Restated)<br />
%<br />
Operating revenues (Notes 2 and 5)<br />
Sales revenue $ 40,060,275 101 $ 26,211,781 100<br />
Sales returns ( 272,962) ( 1) ( 269,831) ( 1)<br />
Sales allowances ( 324,866) ( 1) ( 119,745) -<br />
Net sales revenue 39,462,447 99 25,822,205 99<br />
Services revenue 206,357 1 313,677 1<br />
Total operating revenues<br />
Operating costs (Notes 2 and 5)<br />
39,668,804 100 26,135,882 100<br />
Cost of goods sold ( 31,553,703) ( 80) ( 20,650,761) ( 79)<br />
Gross profit 8,115,101 20 5,485,121 21<br />
Unrealized intercompany loss - - 1,657 -<br />
Realized intercompany loss ( 1,657) - - -<br />
Net gross profit<br />
Operating expenses<br />
8,113,444 20 5,486,778 21<br />
Selling ( 1,822,040) ( 4) ( 1,159,080) ( 5)<br />
Management and administrative ( 890,190) ( 2) ( 813,503) ( 3)<br />
Research and development ( 1,851,520) ( 5) ( 1,272,394) ( 5)<br />
Total operating expenses ( 4,563,750) ( 11) ( 3,244,977) ( 13)<br />
Operating income<br />
Non-operating income<br />
3,549,694 9 2,241,801 8<br />
Interest income 215,943 1 253,562 1<br />
Gain on disposal of property, plant and equipment 45,706 - 12,556 -<br />
Gain on disposal of investments 858,573 2 3,012 -<br />
Foreign exchange gain - net 22,033 - 9,413 -<br />
Reversal of allowance for doubtful accounts 32,061 - 3,257 -<br />
Other income (Note 5) 381,597 1 468,049 2<br />
Total non-operating income<br />
Non-operating expenses<br />
1,555,913 4 749,849 3<br />
Interest expense ( 171,041) ( 1) ( 160,369) ( 1)<br />
Investment loss ( 164,047) - ( 36,425) -<br />
Loss on disposal of property, plant and equipment ( 32,409) - ( 7,771) -<br />
Loss on physical count of inventory<br />
Provision for decline in market value and<br />
( 60,706) - ( 4,077) -<br />
obsolescence of inventory ( 30,960) - - -<br />
Other losses ( 173,025) ( 1) ( 109,404) -<br />
Total non-operating expenses ( 632,188) ( 2) ( 318,046) ( 1)<br />
Income before income tax 4,473,419 11 2,673,604 10<br />
Income tax (Notes 2 and 4(15)) ( 659,762) ( 1) ( 384,929) ( 1)<br />
Income after income tax 3,813,657 10 2,288,675 9<br />
Minority interest in consolidated subsidiaries ( 165,771) ( 1) ( 53,304) -<br />
Net income<br />
Earnings per share (Note 4(16)) (In dollars)<br />
$ 3,647,886 9 $ 2,235,371 9<br />
Income before minority interest $ 5.35 $ 3.44<br />
Minority interest in consolidated subsidiaries ( 0.23) ( 0.08)<br />
Net income $ 5.12 $ 3.36<br />
Please refer to the accompanying notes and PricewaterhouseCoopers' audit report dated February 23, 2000.<br />
20