1999 Annual Report - Delta Electronics
1999 Annual Report - Delta Electronics
1999 Annual Report - Delta Electronics

You also want an ePaper? Increase the reach of your titles
YUMPU automatically turns print PDFs into web optimized ePapers that Google loves.
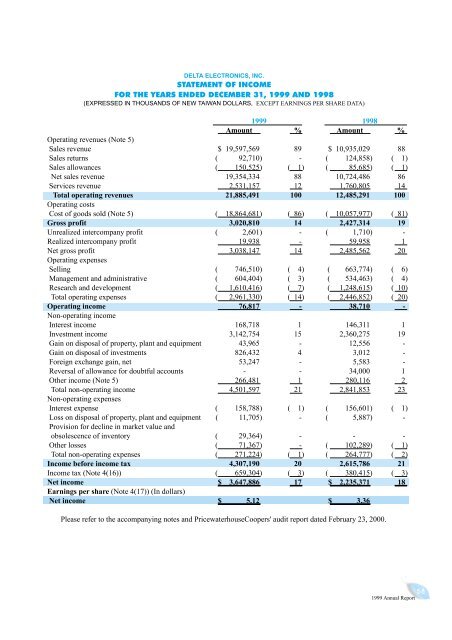
DELTA ELECTRONICS, INC.<br />
STATEMENT OF INCOME<br />
FOR THE YEARS ENDED DECEMBER 31, <strong>1999</strong> AND 1998<br />
(EXPRESSED IN THOUSANDS OF NEW TAIWAN DOLLARS, EXCEPT EARNINGS PER SHARE DATA)<br />
<strong>1999</strong> 1998<br />
Amount % Amount %<br />
Operating revenues (Note 5)<br />
Sales revenue $ 19,597,569 89 $ 10,935,029 88<br />
Sales returns ( 92,710) - ( 124,858) ( 1)<br />
Sales allowances ( 150,525) ( 1) ( 85,685) ( 1)<br />
Net sales revenue 19,354,334 88 10,724,486 86<br />
Services revenue 2,531,157 12 1,760,805 14<br />
Total operating revenues<br />
Operating costs<br />
21,885,491 100 12,485,291 100<br />
Cost of goods sold (Note 5) ( 18,864,681) ( 86) ( 10,057,977) ( 81)<br />
Gross profit 3,020,810 14 2,427,314 19<br />
Unrealized intercompany profit ( 2,601) - ( 1,710) -<br />
Realized intercompany profit 19,938 - 59,958 1<br />
Net gross profit<br />
Operating expenses<br />
3,038,147 14 2,485,562 20<br />
Selling ( 746,510) ( 4) ( 663,774) ( 6)<br />
Management and administrative ( 604,404) ( 3) ( 534,463) ( 4)<br />
Research and development ( 1,610,416) ( 7) ( 1,248,615) ( 10)<br />
Total operating expenses ( 2,961,330) ( 14) ( 2,446,852) ( 20)<br />
Operating income 76,817 - 38,710 -<br />
Non-operating income<br />
Interest income 168,718 1 146,311 1<br />
Investment income 3,142,754 15 2,360,275 19<br />
Gain on disposal of property, plant and equipment 43,965 - 12,556 -<br />
Gain on disposal of investments 826,432 4 3,012 -<br />
Foreign exchange gain, net 53,247 - 5,583 -<br />
Reversal of allowance for doubtful accounts - - 34,000 1<br />
Other income (Note 5) 266,481 1 280,116 2<br />
Total non-operating income<br />
Non-operating expenses<br />
4,501,597 21 2,841,853 23<br />
Interest expense ( 158,788) ( 1) ( 156,601) ( 1)<br />
Loss on disposal of property, plant and equipment<br />
Provision for decline in market value and<br />
( 11,705) - ( 5,887) -<br />
obsolescence of inventory ( 29,364) - - -<br />
Other losses ( 71,367) - ( 102,289) ( 1)<br />
Total non-operating expenses ( 271,224) ( 1) ( 264,777) ( 2)<br />
Income before income tax 4,307,190 20 2,615,786 21<br />
Income tax (Note 4(16)) ( 659,304) ( 3) ( 380,415) ( 3)<br />
Net income<br />
Earnings per share (Note 4(17)) (In dollars)<br />
$ 3,647,886 17 $ 2,235,371 18<br />
Net income $ 5.12 $ 3.36<br />
Please refer to the accompanying notes and PricewaterhouseCoopers' audit report dated February 23, 2000.<br />
58