- Page 1 and 2:
Faculty of Media, Society and Cultu
- Page 3 and 4:
ABSTRACT People with disabilities,
- Page 5 and 6:
3.0 ELEMENTS OF THE DISABILITY DIVI
- Page 7 and 8:
APPENDIX A: PERSONAL INTERVIEWS....
- Page 9 and 10:
ACKNOWLEDGEMENTS The following orga
- Page 11 and 12:
INTRODUCTION Purpose of the study A
- Page 13 and 14:
! Are computing and Internet-relate
- Page 15 and 16:
disabilities in the workforce. As a
- Page 17 and 18:
entertainment package and, at worst
- Page 19 and 20:
Chapter 6, The provision of operati
- Page 21 and 22:
Australia, approximately four milli
- Page 23 and 24:
which people with disabilities perc
- Page 25 and 26:
dependence (J. Wilson & Wilson, 200
- Page 27 and 28:
economic model complements the righ
- Page 29 and 30:
ole of people with disabilities, go
- Page 31 and 32:
time. Policy and resulting legislat
- Page 33 and 34:
improved, funds were now available
- Page 35 and 36:
United Nations (UN) during the Inte
- Page 37 and 38:
actions and participation is connec
- Page 39 and 40:
occasional struggle for people with
- Page 41 and 42:
lindness within society also create
- Page 43 and 44:
communication. This chapter contrib
- Page 45 and 46:
seen as applicable to the developme
- Page 47 and 48:
Although clear-path and object-anal
- Page 49 and 50:
easily interpret text, making the A
- Page 51 and 52:
interface in their next OS release.
- Page 53 and 54:
networks so that there is exchange
- Page 55 and 56:
of information largely inaccessible
- Page 57 and 58:
again become sufficiently accessibl
- Page 59 and 60:
Figure 3.1 Household Computer or In
- Page 61 and 62:
of tertiary education compound the
- Page 63 and 64:
desire to repair the inferior body
- Page 65 and 66:
computing firms seemed to take issu
- Page 67 and 68:
an operating environment which was
- Page 69 and 70:
accessible and compatible with AT p
- Page 71 and 72:
cater for the needs of this group.
- Page 73 and 74:
4.2 Methodology for personal interv
- Page 75 and 76:
! Steger, John. Senior Consultant,
- Page 77 and 78:
All of these points were used with
- Page 79 and 80:
ates improved significantly due to
- Page 81 and 82:
(f) to assist in achieving positive
- Page 83 and 84:
disability-related discrimination i
- Page 85 and 86:
was that Section 508 only applied t
- Page 87 and 88:
in order to combat the disability d
- Page 89 and 90:
Such views again highlight the inco
- Page 91 and 92:
vision disabilities must rely on US
- Page 93 and 94:
5.0 THE PROVISION OF ONLINE INFORMA
- Page 95 and 96:
exist but not how to resolve the pr
- Page 97 and 98:
ace information for the Sydney 2000
- Page 99 and 100:
Essentially, the SOCOG case present
- Page 101 and 102:
In terms of finding out what people
- Page 103 and 104:
devices. The study concluded that t
- Page 105 and 106:
6.0 THE PROVISION OF OPERATING SYST
- Page 107 and 108: networking infrastructure market, w
- Page 109 and 110: Internet were accessible, it could
- Page 111 and 112: developer conferences as a good way
- Page 113 and 114: 6.3 Disability-specific product ven
- Page 115 and 116: company which tries to do everythin
- Page 117 and 118: user through to large networks and
- Page 119 and 120: with low vision was the addition of
- Page 121 and 122: The UNIX platform has faced a diffi
- Page 123 and 124: of writing, Microsoft is being sued
- Page 125 and 126: character containing two dots. Brai
- Page 127 and 128: Figure 6.7 Vario 80 Refreshable Bra
- Page 129 and 130: Figure 6.10 Omni Phantom (SensAble
- Page 131 and 132: addition there are other input-base
- Page 133 and 134: HP, Cisco and IBM have all contribu
- Page 135 and 136: ‘upper-echelons’ of users would
- Page 137 and 138: such as Vision Australia located at
- Page 139 and 140: internal policies reflect the need
- Page 141 and 142: arely given the chance to voice the
- Page 143 and 144: 1. to demonstrate the ways in which
- Page 145 and 146: Section B focused on the use of com
- Page 147 and 148: question was to determine the exten
- Page 149 and 150: defined opinions in this study. The
- Page 151 and 152: the type and significance of an ind
- Page 153 and 154: The print and Braille formats were
- Page 155 and 156: with 23 telephone interviews and 3
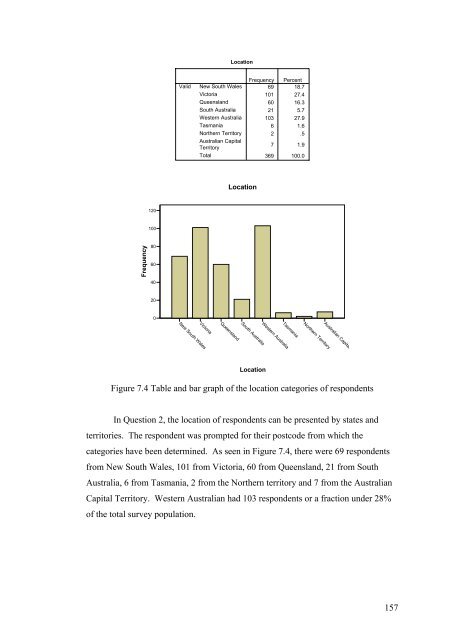
- Page 157: Frequency 100 80 60 40 20 0 Valid 1
- Page 161 and 162: Frequency 200 150 100 50 0 Valid Fu
- Page 163 and 164: Valid Degenerative Stable Total Vis
- Page 165 and 166: Frequency 100 80 60 40 20 0 Valid M
- Page 167 and 168: 7.4.2 Computing and assistive techn
- Page 169 and 170: Frequency 120 100 80 60 40 20 0 Kno
- Page 171 and 172: Frequency 100 80 60 40 20 0 Ability
- Page 173 and 174: Frequency 150 120 90 60 30 0 Valid
- Page 175 and 176: Frequency 140 120 100 80 60 40 20 0
- Page 177 and 178: N Valid Missing Familiarity of Inte
- Page 179 and 180: Frequency 125 100 75 50 25 0 Valid
- Page 181 and 182: Frequency 120 100 80 60 40 20 0 Val
- Page 183 and 184: Frequency 100 80 60 40 20 0 Valid D
- Page 185 and 186: Internet session will contain a var
- Page 187 and 188: Frequency 250 200 150 100 50 0 Vali
- Page 189 and 190: Frequency 250 200 150 100 50 0 Vali
- Page 191 and 192: Frequency 120 100 80 60 40 20 0 Dis
- Page 193 and 194: Frequency 120 100 80 60 40 20 0 Gov
- Page 195 and 196: Frequency 140 120 100 80 60 40 20 0
- Page 197 and 198: Frequency 120 100 80 60 40 20 0 Des
- Page 199 and 200: Frequency 100 80 60 40 20 0 Valid I
- Page 201 and 202: 7.4.5 Open-ended comments The Comme
- Page 203 and 204: There were also a number of comment
- Page 205 and 206: 8.0 ANALYSIS OF FINDINGS 8.1 Introd
- Page 207 and 208: levels of the working population. A
- Page 209 and 210:
the colour scheme question received
- Page 211 and 212:
Respondents were fairly evenly spre
- Page 213 and 214:
esult indicated that it is likely t
- Page 215 and 216:
able to interact with computing and
- Page 217 and 218:
Count Ability to Understand and Use
- Page 219 and 220:
Ability to Understand and Use a Com
- Page 221 and 222:
that knowledge of IT did not necess
- Page 223 and 224:
impaired people were not associated
- Page 225 and 226:
Count Income Total Income * Cost of
- Page 227 and 228:
8.3.5 Disability-specific issues fo
- Page 229 and 230:
The final comparison focused on the
- Page 231 and 232:
CONCLUSION Addressing the research
- Page 233 and 234:
with vision disabilities until the
- Page 235 and 236:
ole of this policy, in terms of inf
- Page 237 and 238:
een largely resolved in recent time
- Page 239 and 240:
vision disabilities perceived the I
- Page 241 and 242:
In essence, this study has revealed
- Page 243 and 244:
! the creation and implementation o
- Page 245 and 246:
Australian Federal Government. (200
- Page 247 and 248:
Galitz, W. (2002). Essential Guide
- Page 249 and 250:
Lindlif, T. R., & Shatzer, M. J. (1
- Page 251 and 252:
Stubbins, J. (1977). Social and Psy
- Page 253 and 254:
Zakon, R. (2002, 1 April). Hobbes'
- Page 255 and 256:
ETHICS APPROVAL: products and servi
- Page 257 and 258:
Name: _ Signature: Date: authorizat
- Page 259 and 260:
13. In the United States, the Rehab
- Page 261 and 262:
8. Do you perceive that people with
- Page 263 and 264:
Title: Department: Organisation: Ye
- Page 265 and 266:
18. In your opinion, are educationa
- Page 267 and 268:
e found at http://www.vipsurvey.org
- Page 269 and 270:
[ ] 2 Living in shared accommodatio
- Page 271 and 272:
[ ] 1 Screen magnification software
- Page 273 and 274:
24. My ability to use the Internet
- Page 275 and 276:
process which I mastered by myself:
- Page 277 and 278:
! 5.2 For data tables that have two
- Page 279 and 280:
! 10.5 Until user agents (including
- Page 281:
IBM International Business Machines