Annual Report - JD Group
Annual Report - JD Group
Annual Report - JD Group

Create successful ePaper yourself
Turn your PDF publications into a flip-book with our unique Google optimized e-Paper software.
45<br />
2004 2003<br />
Rm Rm<br />
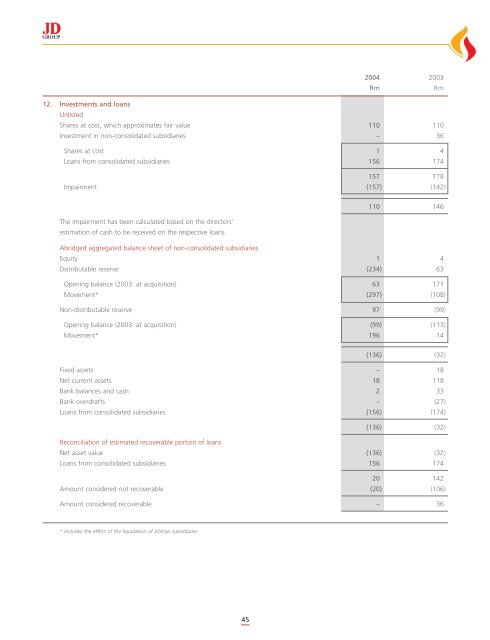
12. Investments and loans<br />
Unlisted<br />
Shares at cost, which approximates fair value 110 110<br />
Investment in non-consolidated subsidiaries – 36<br />
Shares at cost 1 4<br />
Loans from consolidated subsidiaries 156 174<br />
157 178<br />
Impairment (157) (142)<br />
The impairment has been calculated based on the directors’<br />
estimation of cash to be received on the respective loans.<br />
110 146<br />
Abridged aggregated balance sheet of non-consolidated subsidiaries<br />
Equity 1 4<br />
Distributable reserve (234) 63<br />
Opening balance (2003: at acquisition) 63 171<br />
Movement* (297) (108)<br />
Non-distributable reserve 97 (99)<br />
Opening balance (2003: at acquisition) (99) (113)<br />
Movement* 196 14<br />
(136) (32)<br />
Fixed assets – 18<br />
Net current assets 18 118<br />
Bank balances and cash 2 33<br />
Bank overdrafts – (27)<br />
Loans from consolidated subsidiaries (156) (174)<br />
(136) (32)<br />
Reconciliation of estimated recoverable portion of loans<br />
Net asset value (136) (32)<br />
Loans from consolidated subsidiaries 156 174<br />
20 142<br />
Amount considered not recoverable (20) (106)<br />
Amount considered recoverable – 36<br />
* Includes the effect of the liquidation of African subsidiaries