Annual Report - JD Group
Annual Report - JD Group
Annual Report - JD Group

Create successful ePaper yourself
Turn your PDF publications into a flip-book with our unique Google optimized e-Paper software.
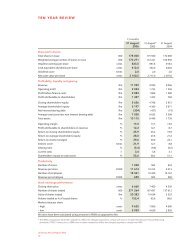
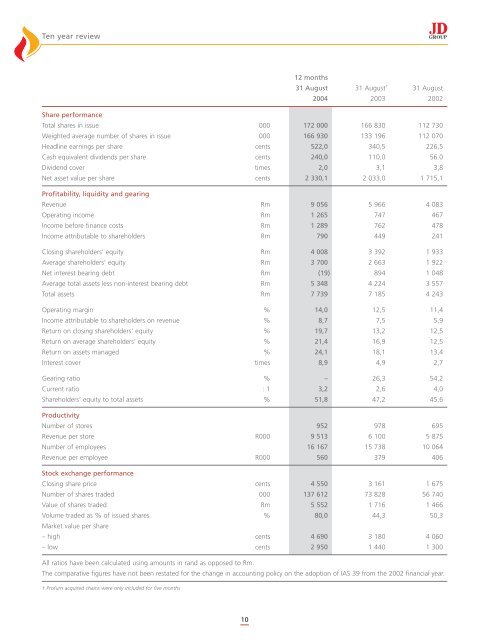
Ten year review<br />
10<br />
12 months<br />
31 August 31 August †<br />
31 August<br />
2004 2003 2002<br />
Share performance<br />
Total shares in issue 000 172 000 166 830 112 730<br />
Weighted average number of shares in issue 000 166 930 133 196 112 070<br />
Headline earnings per share cents 522,0 340,5 226,5<br />
Cash equivalent dividends per share cents 240,0 110,0 56.0<br />
Dividend cover times 2,0 3,1 3,8<br />
Net asset value per share cents 2 330,1 2 033,0 1 715,1<br />
Profitability, liquidity and gearing<br />
Revenue Rm 9 056 5 966 4 083<br />
Operating income Rm 1 265 747 467<br />
Income before finance costs Rm 1 289 762 478<br />
Income attributable to shareholders Rm 790 449 241<br />
Closing shareholders’ equity Rm 4 008 3 392 1 933<br />
Average shareholders’ equity Rm 3 700 2 663 1 922<br />
Net interest bearing debt Rm (19) 894 1 048<br />
Average total assets less non-interest bearing debt Rm 5 348 4 224 3 557<br />
Total assets Rm 7 739 7 185 4 243<br />
Operating margin % 14,0 12,5 11,4<br />
Income attributable to shareholders on revenue % 8,7 7,5 5,9<br />
Return on closing shareholders’ equity % 19,7 13,2 12,5<br />
Return on average shareholders’ equity % 21,4 16,9 12,5<br />
Return on assets managed % 24,1 18,1 13,4<br />
Interest cover times 8,9 4,9 2,7<br />
Gearing ratio % – 26,3 54,2<br />
Current ratio : 1 3,2 2,6 4,0<br />
Shareholders’ equity to total assets % 51,8 47,2 45,6<br />
Productivity<br />
Number of stores 952 978 695<br />
Revenue per store R000 9 513 6 100 5 875<br />
Number of employees 16 167 15 738 10 064<br />
Revenue per employee R000 560 379 406<br />
Stock exchange performance<br />
Closing share price cents 4 550 3 161 1 675<br />
Number of shares traded 000 137 612 73 828 56 740<br />
Value of shares traded Rm 5 552 1 716 1 466<br />
Volume traded as % of issued shares<br />
Market value per share<br />
% 80,0 44,3 50,3<br />
– high cents 4 690 3 180 4 060<br />
– low cents 2 950 1 440 1 300<br />
All ratios have been calculated using amounts in rand as opposed to Rm.<br />
The comparative figures have not been restated for the change in accounting policy on the adoption of IAS 39 from the 2002 financial year.<br />
† Profurn acquired chains were only included for five months