Annual Report - JD Group
Annual Report - JD Group
Annual Report - JD Group

You also want an ePaper? Increase the reach of your titles
YUMPU automatically turns print PDFs into web optimized ePapers that Google loves.
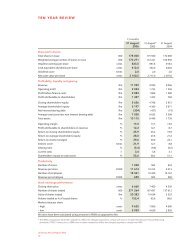
Ten year review continued<br />
12<br />
12 months<br />
31 August 31 August †<br />
31 August<br />
2004 2003 2002<br />
Income statements<br />
Revenue 9 056 5 966 4 083<br />
Cost of sales 4 148 2 613 1 657<br />
Operating income 1 265 747 467<br />
Investment income 24 15 11<br />
Income before finance costs 1 289 762 478<br />
Finance costs – net 145 154 179<br />
Income before exceptional item 1 144 608 299<br />
Exceptional item: loss on discontinuance – – –<br />
Income before taxation 1 144 608 299<br />
Taxation 354 160 60<br />
Income after taxation 790 448 239<br />
Attributable to outside shareholders – 1 2<br />
Income attributable to shareholders 790 449 241<br />
Balance sheets<br />
Assets<br />
Non-current assets 645 1 026 345<br />
Property, plant and equipment 210 210 144<br />
Goodwill – 42 54<br />
Trademark 165 315 –<br />
Investments and loans 110 146 110<br />
Deferred taxation 160 313 37<br />
Current assets 7 094 6 159 3 898<br />
Inventories 784 739 427<br />
Trade and other receivables 4 871 4 860 3 231<br />
Financial assets 34 36 13<br />
Taxation 77 80 5<br />
Bank balances and cash 1 328 444 222<br />
Total assets<br />
Equity and liabilities<br />
Equity and reserves<br />
7 739 7 185 4 243<br />
Share capital and premium 1 903 1 778 782<br />
Treasury shares (88) (39) (22)<br />
Non-distributable reserve 137 127 24<br />
Retained income 1 803 1 415 1 124<br />
Shareholders for dividend 253 111 25<br />
Shareholders’ equity 4 008 3 392 1 933<br />
Outside shareholders’ interest – – 21<br />
Non-current liabilities 1 487 1 412 1 310<br />
Interest bearing long term liabilities 947 831 1 049<br />
Deferred taxation 540 581 261<br />
Current liabilities 2 244 2 381 979<br />
Trade and other payables 1 787 1 801 745<br />
Interest bearing liabilities 362 506 219<br />
Financial liabilities 8 9 11<br />
Taxation 87 64 2<br />
Bank overdrafts – 1 2<br />
Total equity and liabilities 7 739 7 185 4 243<br />
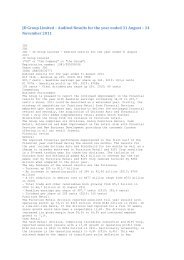
† Profurn acquired chains were only included for five months