Annual Report - JD Group
Annual Report - JD Group
Annual Report - JD Group

Create successful ePaper yourself
Turn your PDF publications into a flip-book with our unique Google optimized e-Paper software.
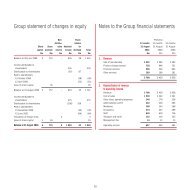
Segmental analysis – chains<br />
Southern Africa<br />
Russells Joshua Doore Bradlows Price ’n Pride<br />
2004 2003 2004 2003 2004 2003 2004 2003<br />
Revenue Rm 1 877 1 572 1 353 1 174 702 647 788 642<br />
Operating income Rm 469 313 274 197 123 76 153 84<br />
Depreciation Rm 2 2 2 2 1 1 1 1<br />
Total assets Rm 1 379 1 352 977 968 517 513 699 660<br />
Total current liabilities Rm 257 233 198 184 116 96 87 81<br />
Capital expenditure Rm 2 1 2 2 1 1 1 2<br />
Operating margin % 25,0 19,9 20,3 16,8 17,5 11,7 19,4 13,1<br />
Total sale of merchandise Rm 1 099 912 788 689 454 415 405 331<br />
Share of <strong>Group</strong> sale of merchandise % 17,9 23,9 12,9 18,0 7,4 10,9 6,6 8,7<br />
Credit sales Rm 841 760 576 533 342 324 372 308<br />
Percentage of total % 76,5 83,3 73,1 77,4 75,3 78,1 91,9 93,1<br />
Cash sales Rm 258 152 212 156 112 91 33 23<br />
Percentage of total % 23,5 16,7 26,9 22,6 24,7 21,9 8,1 6,9<br />
Deposit rate on credit sales % 14,2 12,0 17,2 14,4 18,8 18,5 13,8 13,5<br />
Number of stores 199 198 146 149 84 88 118 117<br />
Revenue per store R000 9 432 7 939 9 267 7 879 8 357 7 352 6 678 5 487<br />
Retail square meterage 141 860 139 002 115 712 116 655 63 131 65 121 71 472 69 726<br />
Revenue per square metre Rand 13 231 11 309 11 693 10 064 11 120 9 935 11 025 9 207<br />
Number of employees 3 109 3 016 2 471 2 430 1 399 1 447 1 947 1 912<br />
Revenue per employee R000 604 521 548 483 502 447 405 336<br />
Instalment sale receivables – gross Rm 1 730 1 684 1 176 1 175 570 574 905 838<br />
Bad debts written off<br />
Bad debts written off as a<br />
Rm 113 95 79 64 23 33 98 67<br />
percentage of gross receivables % 6,5 5,6 6,7 5,4 4,0 5,7 10,8 8,0<br />
Receivables’ arrears<br />
Receivables’ arrears as a<br />
Rm 227 282 116 152 51 63 149 189<br />
percentage of gross receivables % 13,1 16,7 9,9 12,9 8,9 11,0 16,5 22,6<br />
Collection rate % 7,0 6,5 7,1 6,7 8,0 7,5 5,9 5,5<br />
Average length of the book Months 14,3 15,3 14,1 14,9 12,5 13,4 16,9 18,3<br />
* The trading results of 19 stores that were closed in the BLNS countries are included in this analysis up until the date of closure but the number of stores, number of employees<br />
and retail square meterage are not shown at the year end. Accordingly, the calculations for revenue per store, per employee and per square metre are overstated. Also included<br />
in “other” are the 7 stores in Mozambique which the <strong>Group</strong> is in the process of disposing of. The balance of the stores will be integrated in due course.<br />
† These chains were only consolidated for a 5 month period in 2003, therefore certain calculations have not been presented as it is considered that they would not be meaningful.<br />
‡ Businesses disposed of and closed therefore certain calculations have not been presented.<br />
º Operations to be integrated, disposed of and/or discontinued.<br />
56