Annual Report - JD Group
Annual Report - JD Group
Annual Report - JD Group

Create successful ePaper yourself
Turn your PDF publications into a flip-book with our unique Google optimized e-Paper software.
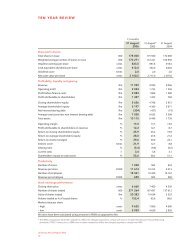
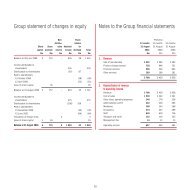
<strong>Group</strong> value added statement<br />
13<br />
2004 2003<br />
Rm % Rm* %<br />
Revenue 9 056 5 966<br />
Investment income 24 15<br />
Interest received 62 49<br />
9 142 6 030<br />
Cost of merchandise, services and expenses (6 370) (4 195)<br />
Value added 2 772 100,0 1 835 100,0<br />
Distributed as follows:<br />
Employees<br />
Salaries, commissions and other benefits<br />
Government<br />
Taxation, assessment rates and<br />
1 296 46,8 933 50,8<br />
regional services council levies 179 6,5 47 2,6<br />
Providers of capital 622 22,4 363 19,8<br />
Distribution to shareholders 415 15,0 160 8,7<br />
Finance costs 207 7,4 203 11,1<br />
Reinvestment in the <strong>Group</strong> 675 24,3 492 26,8<br />
To provide for depreciation 94 3,4 67 3,7<br />
To provide for deferred taxation 206 7,4 136 7,4<br />
Reinvested for expansion 375 13,5 289 15,7<br />
2 772 100,0 1 835 100,0<br />
Statement of money exchanges with government<br />
Assessment rates and taxes 16 13<br />
Company taxes 148 24<br />
Employees’ tax deducted from remuneration paid 164 112<br />
Net value added tax and general sales tax (refunded)/collected 69 (4)<br />
Regional services council levies 15 10<br />
412 155<br />
Value added is the amount of wealth the <strong>Group</strong> has created by purchasing and selling its merchandise. The statement above shows how this<br />
wealth has been distributed. The calculation takes into account the amounts retained and reinvested in the <strong>Group</strong> for the replacement of<br />
assets and development of operations.<br />
* Restated