Arani Town - Municipal
Arani Town - Municipal
Arani Town - Municipal
You also want an ePaper? Increase the reach of your titles
YUMPU automatically turns print PDFs into web optimized ePapers that Google loves.
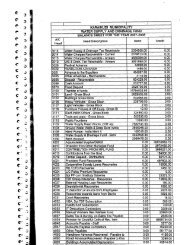
Annexure Final Report: <strong>Arani</strong> <strong>Municipal</strong>ity<br />
Annexure IX - s: Key Financial Indicators<br />
Indicators Value Unit<br />
A Resource Mobilization<br />
1 Per Capita Income 552 Rs. p.a<br />
2 Sources of Funds<br />
a)<br />
Share of Own Sources in Total Revenue<br />
Income (RI)<br />
62 %<br />
b)<br />
Share of Property Tax in Total Revenue<br />
Income<br />
27 %<br />
c)<br />
Share of Revenue Grants & Subsidies in<br />
Total RI<br />
38 %<br />
3 Growth in Revenue Income 8.69 % p.a.<br />
4<br />
Growth in Own Sources of<br />
Revenue Income<br />
3.08 %<br />
5 Per Capita Own Income 341 Rs. p.a<br />
B Fund Application<br />
1 Per Capita Expenditure 470 Rs. p.a<br />
2 Uses of Funds<br />
a)<br />
Share of Establishment Expenditure in<br />
Total RE<br />
49 %<br />
b)<br />
Share of O&M Expenditure in Total<br />
Revenue Expenditure<br />
22 %<br />
c)<br />
Share of Establishment Expenditure to<br />
Total RI<br />
42 %<br />
3<br />
Growth in Establishment<br />
Expenditure<br />
(0.31) %<br />
4 Growth in O&M Expenditure 26.06 %<br />
5<br />
Growth in Total Revenue<br />
Expenditure<br />
(1.44) % p.a.<br />
C Liability Management<br />
1 Per Capita Liability<br />
a) Outstanding debt per Capita 329 Rs.<br />
b)<br />
Outstanding Non-Debt Liability per<br />
Capita<br />
- Rs.<br />
c) Total Outstanding Liability Per Capita 329 Rs.<br />
2<br />
As a Proportion of Property<br />
Tax Current Demand<br />
a) Outstanding Debt as % of P.T Demand 222 %<br />
b)<br />
Outstanding Non-Debt Liability as % of<br />
P.T Demand<br />
-<br />
c)<br />
Total Outstanding Liability as % of P.T<br />
Demand<br />
222 %<br />
3<br />
As a Proportion of Property<br />
Tax Own Revenue Income<br />
a)<br />
Outstanding Debt as % of Own<br />
Revenue Sources<br />
96 %<br />
b)<br />
O/s Non-Debt Liability as % of Own<br />
Revenue Sources<br />
-<br />
c)<br />
Total Outstanding Liability as % Own<br />
Revenue Sources<br />
96 %<br />
4<br />
Non-Debt Liability as % of<br />
Total Liability<br />
-<br />
5<br />
Debt Servicing Ratio (D/S<br />
Revenue Income)<br />
1.42 %<br />
D Performance Indicators<br />
. - 159 -<br />
Voyants Solutions Private Limited


