MySQL Cluster Tutorial - cdn.oreillystatic.com
MySQL Cluster Tutorial - cdn.oreillystatic.com
MySQL Cluster Tutorial - cdn.oreillystatic.com

You also want an ePaper? Increase the reach of your titles
YUMPU automatically turns print PDFs into web optimized ePapers that Google loves.
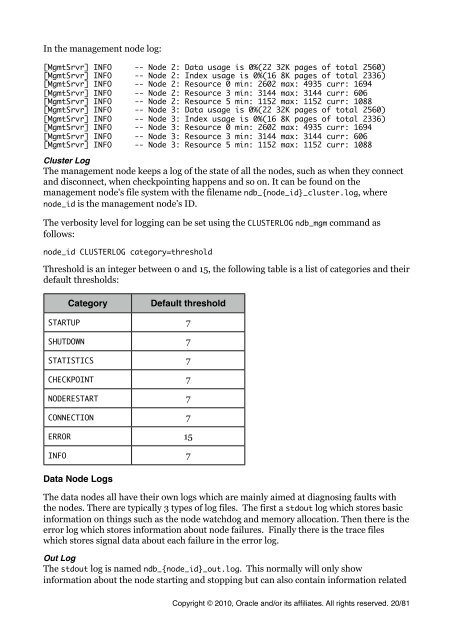
In the management node log:<br />
[MgmtSrvr] INFO -- Node 2: Data usage is 0%(22 32K pages of total 2560)<br />
[MgmtSrvr] INFO -- Node 2: Index usage is 0%(16 8K pages of total 2336)<br />
[MgmtSrvr] INFO -- Node 2: Resource 0 min: 2602 max: 4935 curr: 1694<br />
[MgmtSrvr] INFO -- Node 2: Resource 3 min: 3144 max: 3144 curr: 606<br />
[MgmtSrvr] INFO -- Node 2: Resource 5 min: 1152 max: 1152 curr: 1088<br />
[MgmtSrvr] INFO -- Node 3: Data usage is 0%(22 32K pages of total 2560)<br />
[MgmtSrvr] INFO -- Node 3: Index usage is 0%(16 8K pages of total 2336)<br />
[MgmtSrvr] INFO -- Node 3: Resource 0 min: 2602 max: 4935 curr: 1694<br />
[MgmtSrvr] INFO -- Node 3: Resource 3 min: 3144 max: 3144 curr: 606<br />
[MgmtSrvr] INFO -- Node 3: Resource 5 min: 1152 max: 1152 curr: 1088<br />
<strong>Cluster</strong> Log<br />
The management node keeps a log of the state of all the nodes, such as when they connect<br />
and disconnect, when checkpointing happens and so on. It can be found on the<br />
management node's file system with the filename ndb_{node_id}_cluster.log, where<br />
node_id is the management node's ID.<br />
The verbosity level for logging can be set using the CLUSTERLOG ndb_mgm <strong>com</strong>mand as<br />
follows:<br />
node_id CLUSTERLOG category=threshold<br />
Threshold is an integer between 0 and 15, the following table is a list of categories and their<br />
default thresholds:<br />
Category Default threshold<br />
STARTUP 7<br />
SHUTDOWN 7<br />
STATISTICS 7<br />
CHECKPOINT 7<br />
NODERESTART 7<br />
CONNECTION 7<br />
ERROR 15<br />
INFO 7<br />
Data Node Logs<br />
The data nodes all have their own logs which are mainly aimed at diagnosing faults with<br />
the nodes. There are typically 3 types of log files. The first a stdout log which stores basic<br />
information on things such as the node watchdog and memory allocation. Then there is the<br />
error log which stores information about node failures. Finally there is the trace files<br />
which stores signal data about each failure in the error log.<br />
Out Log<br />
The stdout log is named ndb_{node_id}_out.log. This normally will only show<br />
information about the node starting and stopping but can also contain information related<br />
Copyright © 2010, Oracle and/or its affiliates. All rights reserved. 20/81