THE FLORIDA STATE UNIVERSITY ARTS AND SCIENCES ...
THE FLORIDA STATE UNIVERSITY ARTS AND SCIENCES ...
THE FLORIDA STATE UNIVERSITY ARTS AND SCIENCES ...
You also want an ePaper? Increase the reach of your titles
YUMPU automatically turns print PDFs into web optimized ePapers that Google loves.
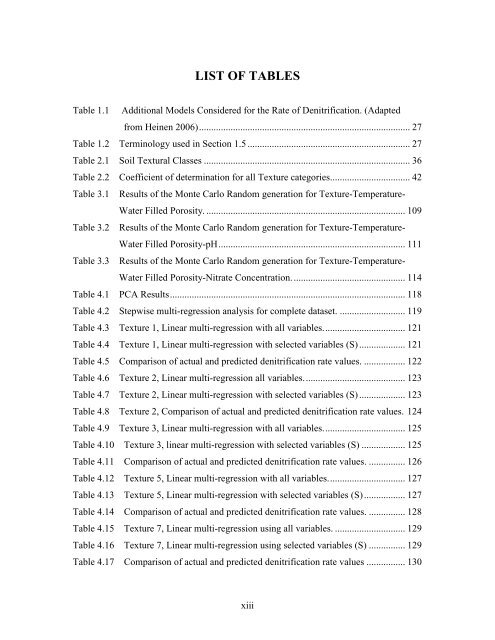
LIST OF TABLES<br />
Table 1.1 Additional Models Considered for the Rate of Denitrification. (Adapted<br />
from Heinen 2006)....................................................................................... 27<br />
Table 1.2 Terminology used in Section 1.5 ................................................................... 27<br />
Table 2.1 Soil Textural Classes ..................................................................................... 36<br />
Table 2.2 Coefficient of determination for all Texture categories................................. 42<br />
Table 3.1 Results of the Monte Carlo Random generation for Texture-Temperature-<br />
Water Filled Porosity. .................................................................................. 109<br />
Table 3.2 Results of the Monte Carlo Random generation for Texture-Temperature-<br />
Water Filled Porosity-pH............................................................................. 111<br />
Table 3.3 Results of the Monte Carlo Random generation for Texture-Temperature-<br />
Water Filled Porosity-Nitrate Concentration............................................... 114<br />
Table 4.1 PCA Results................................................................................................. 118<br />
Table 4.2 Stepwise multi-regression analysis for complete dataset. ........................... 119<br />
Table 4.3 Texture 1, Linear multi-regression with all variables.................................. 121<br />
Table 4.4 Texture 1, Linear multi-regression with selected variables (S) ................... 121<br />
Table 4.5 Comparison of actual and predicted denitrification rate values. ................. 122<br />
Table 4.6 Texture 2, Linear multi-regression all variables.......................................... 123<br />
Table 4.7 Texture 2, Linear multi-regression with selected variables (S) ................... 123<br />
Table 4.8 Texture 2, Comparison of actual and predicted denitrification rate values. 124<br />
Table 4.9 Texture 3, Linear multi-regression with all variables.................................. 125<br />
Table 4.10 Texture 3, linear multi-regression with selected variables (S) .................. 125<br />
Table 4.11 Comparison of actual and predicted denitrification rate values. ............... 126<br />
Table 4.12 Texture 5, Linear multi-regression with all variables................................ 127<br />
Table 4.13 Texture 5, Linear multi-regression with selected variables (S)................. 127<br />
Table 4.14 Comparison of actual and predicted denitrification rate values. ............... 128<br />
Table 4.15 Texture 7, Linear multi-regression using all variables. ............................. 129<br />
Table 4.16 Texture 7, Linear multi-regression using selected variables (S) ............... 129<br />
Table 4.17 Comparison of actual and predicted denitrification rate values ................ 130<br />
xiii


