THE FLORIDA STATE UNIVERSITY ARTS AND SCIENCES ...
THE FLORIDA STATE UNIVERSITY ARTS AND SCIENCES ...
THE FLORIDA STATE UNIVERSITY ARTS AND SCIENCES ...

Create successful ePaper yourself
Turn your PDF publications into a flip-book with our unique Google optimized e-Paper software.
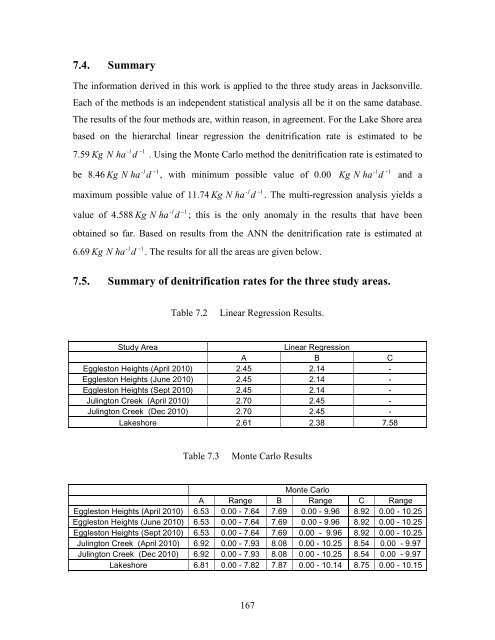
7.4. Summary<br />
The information derived in this work is applied to the three study areas in Jacksonville.<br />
Each of the methods is an independent statistical analysis all be it on the same database.<br />
The results of the four methods are, within reason, in agreement. For the Lake Shore area<br />
based on the hierarchal linear regression the denitrification rate is estimated to be<br />
7.59 Kg N ha<br />
-1<br />
d<br />
−1<br />
be 8.46 Kg N ha<br />
-1<br />
d<br />
. Using the Monte Carlo method the denitrification rate is estimated to<br />
−1<br />
, with minimum possible value of 0.00<br />
maximum possible value of 11.74 Kg N ha<br />
value of 4.588 Kg N ha<br />
-1<br />
d<br />
−1<br />
-1<br />
d<br />
167<br />
−1<br />
Kg N ha<br />
-1<br />
d<br />
−1<br />
and a<br />
. The multi-regression analysis yields a<br />
; this is the only anomaly in the results that have been<br />
obtained so far. Based on results from the ANN the denitrification rate is estimated at<br />
6.69 Kg N ha<br />
-1<br />
d<br />
−1<br />
. The results for all the areas are given below.<br />
7.5. Summary of denitrification rates for the three study areas.<br />
Table 7.2 Linear Regression Results.<br />
Study Area Linear Regression<br />
A B C<br />
Eggleston Heights (April 2010) 2.45 2.14 -<br />
Eggleston Heights (June 2010) 2.45 2.14 -<br />
Eggleston Heights (Sept 2010) 2.45 2.14 -<br />
Julington Creek (April 2010) 2.70 2.45 -<br />
Julington Creek (Dec 2010) 2.70 2.45 -<br />
Lakeshore 2.61 2.38 7.58<br />
Table 7.3 Monte Carlo Results<br />
Monte Carlo<br />
A Range B Range C Range<br />
Eggleston Heights (April 2010) 6.53 0.00 - 7.64 7.69 0.00 - 9.96 8.92 0.00 - 10.25<br />
Eggleston Heights (June 2010) 6.53 0.00 - 7.64 7.69 0.00 - 9.96 8.92 0.00 - 10.25<br />
Eggleston Heights (Sept 2010) 6.53 0.00 - 7.64 7.69 0.00 - 9.96 8.92 0.00 - 10.25<br />
Julington Creek (April 2010) 6.92 0.00 - 7.93 8.08 0.00 - 10.25 8.54 0.00 - 9.97<br />
Julington Creek (Dec 2010) 6.92 0.00 - 7.93 8.08 0.00 - 10.25 8.54 0.00 - 9.97<br />
Lakeshore 6.81 0.00 - 7.82 7.87 0.00 - 10.14 8.75 0.00 - 10.15