- Page 1 and 2:
THE FLORIDA STATE UNIVERSITY ARTS A
- Page 3 and 4:
To my Dad, Mum and Brother iii
- Page 5 and 6:
Dr. Stephen Kish for his words of e
- Page 7 and 8:
1.5. Evaluation of methods to estim
- Page 9 and 10:
2.5.8. Texture 8 (Silt Loam).......
- Page 11 and 12:
4.2.6. Texture 6 (Sandy Clay Loam).
- Page 13 and 14:
LIST OF TABLES Table 1.1 Additional
- Page 15 and 16:
LIST OF FIGURES Figure 1.1 Oxidatio
- Page 17 and 18:
Figure 2.51 8-20-84; Denitrificatio
- Page 19 and 20: Figure 3.6 Probability plot (Textur
- Page 21 and 22: Three statistical methods were used
- Page 23 and 24: • Microbial biomass/ plant uptake
- Page 25 and 26: Figure 1.1 Oxidation of organic car
- Page 27 and 28: possibility of denitrification (Smi
- Page 29 and 30: 50ºC (36ºF - 122ºF) (Brady & Wei
- Page 31 and 32: 1.2.6. Salinity Salinity is a known
- Page 33 and 34: 1.3.1. The Acetylene inhibition met
- Page 35 and 36: Among the variety of successful met
- Page 37 and 38: a first-order decay process. The ma
- Page 39 and 40: look at the data shows that it fail
- Page 41 and 42: Da is the denitrification rate (mg
- Page 43 and 44: a simple linear regression of organ
- Page 45 and 46: of the annual N2O emission and deni
- Page 47 and 48: easons for the limitation of the mo
- Page 49 and 50: Table 1.2 Continued dC / dt Organic
- Page 51 and 52: also implies that the transferabili
- Page 53 and 54: CHAPTER TWO 2. LINEAR REGRESSION An
- Page 55 and 56: an improvement on the earlier attem
- Page 57 and 58: 2.3. Texture Table 2.1 Soil Textura
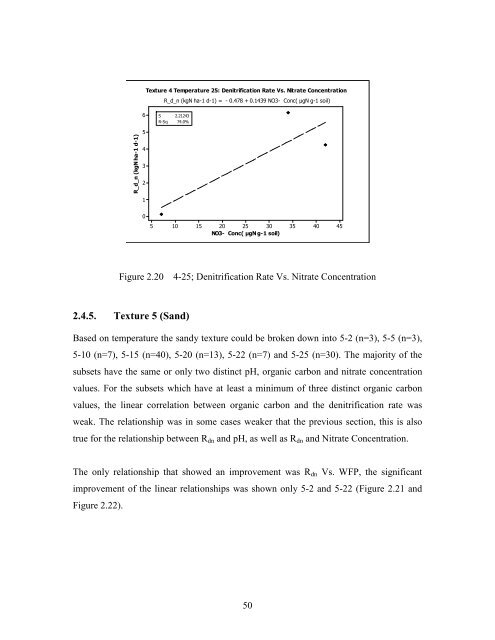
- Page 59 and 60: 2.3.5. Texture 5 (Sand) The surfici
- Page 61 and 62: 2.3.10. Texture 10 (Silty Clay Loam
- Page 63 and 64: Textural Class Table 2.2 Coefficien
- Page 65 and 66: R_d_n (kgN ha-1 d-1) R_d_n (kgN ha-
- Page 67 and 68: 2.4.3. Texture 3 (Loam) Texture 3 c
- Page 69: R_d_n (kgN ha-1 d-1) Texture 3 Temp
- Page 73 and 74: 2.4.7. Texture 7 (Sandy Loam) The S
- Page 75 and 76: Texture 7 Temperature 12 : Denitrif
- Page 77 and 78: Texture 7 Temperature 28 : Denitrif
- Page 79 and 80: Texture 8 Temperature 15 : Denitrif
- Page 81 and 82: Rdn (kgN ha-1 d-1) Texture 9 Temper
- Page 83 and 84: Rdn (kgN ha-1 d-1) 16 12 8 4 0 Text
- Page 85 and 86: 2.5. Break down by Texture, Tempera
- Page 87 and 88: Rdn (kgN ha-1 d-1) Texture 3 Temper
- Page 89 and 90: 8-20-34 (n=3), 8-20-84 (n=4), 8-20-
- Page 91 and 92: Rdn (kgN ha-1 d-1) Texture 8 Temper
- Page 93 and 94: Subsets 9-7-100, 9-25-100 and 9-30-
- Page 95 and 96: Texture 10 Temperature 25 WFP 100 :
- Page 97 and 98: a significant linear relationship b
- Page 99 and 100: Rdn (kgN ha-1 d-1) Texture 5 Temper
- Page 101 and 102: Rdn (kgN ha-1 d-1) Texture 7 Temper
- Page 103 and 104: Rdn (kgN ha-1 d-1) Texture 8 Temper
- Page 105 and 106: Rdn (kgN ha-1 d-1) Rdn (kgN ha-1 d-
- Page 107 and 108: Rdn (kgN ha-1 d-1) Texture 8 Temper
- Page 109 and 110: C9 Rdn (kgN ha-1 d-1) 12 10 8 6 4 2
- Page 111 and 112: Rdn (kgN ha-1 d-1) Rdn (kgN ha-1 d-
- Page 113 and 114: Rdn (kgN ha-1 d-1) Texture 10 Tempe
- Page 115 and 116: 2.6.11. Texture 11 (Silt) No data a
- Page 117 and 118: 2.7.6. Texture 6 (Sandy Clay Loam)
- Page 119 and 120: Rdn (kgN ha-1 d-1) Rdn (kgN ha-1 d-
- Page 121 and 122:
Rdn (kgN ha-1 d-1) Texture 8 Tepera
- Page 123 and 124:
Rdn (kgN ha-1 d-1) Texture 8 Tepera
- Page 125 and 126:
2.8. Summary The correlation coeffi
- Page 127 and 128:
where, M is the slope of the linear
- Page 129 and 130:
Hence for the first set of equation
- Page 131 and 132:
3.2.2. Texture-Temperature-WFP-pH T
- Page 133 and 134:
Organic Carbon (%) Actual Rdn Gener
- Page 135 and 136:
R dn Results C = 9.389 - 3.210* M -
- Page 137 and 138:
The actual denitrification values f
- Page 139 and 140:
Eigenvalue 1.5 1.4 1.3 1.2 1.1 1.0
- Page 141 and 142:
R indicated by the significant code
- Page 143 and 144:
R Table 4.5 Comparison of actual an
- Page 145 and 146:
Table 4.8 Texture 2, Comparison of
- Page 147 and 148:
Table 4.11 Comparison of actual and
- Page 149 and 150:
The two equations are applied to th
- Page 151 and 152:
R R dn dn = - 0.05 ∗Temperature (
- Page 153 and 154:
Table 4.19 Texture 8, Linear multi-
- Page 155 and 156:
Table 4.20 Continued Actual Rdn Pre
- Page 157 and 158:
Once again the equations developed
- Page 159 and 160:
4.2.11. Texture 11 (Silt) No data a
- Page 161 and 162:
CHAPTER FIVE 5. ANALYSIS USING NEUR
- Page 163 and 164:
Figure 5.2 McCulloch-Pitts (Meyer-B
- Page 165 and 166:
developed. In order to control over
- Page 167 and 168:
Eventually the final set of network
- Page 169 and 170:
5.4.4. Texture 5 (Sand) Figure 5.5
- Page 171 and 172:
5.4.6. Texture 8 (Silt Loam) Figure
- Page 173 and 174:
5.4.8. Texture 10 (Silty Clay Loam)
- Page 175 and 176:
CHAPTER SIX 6. USE OF ISOTOPES TO E
- Page 177 and 178:
18 ⎛ ⎛ ⎜ O ⎞ 16 ⎜ ⎜ ⎟
- Page 179 and 180:
Figure 6.1 Estimation of Nitrate Lo
- Page 181 and 182:
δ 18 O 12 10 8 6 4 2 Table 6.1 Egg
- Page 183 and 184:
δ 18 O 20.00 18.00 16.00 14.00 12.
- Page 185 and 186:
CHAPTER SEVEN 7. APPLICATION TO JAC
- Page 187 and 188:
7.2. Multiple Regression Three equa
- Page 189 and 190:
Table 7.4 Multi-Regression and Neur
- Page 191 and 192:
8.3. Main Results The linear equati
- Page 193 and 194:
isotopes can be particularly useful
- Page 195 and 196:
APPENDIX B CONVERSION SHEET FOR DEN
- Page 197 and 198:
iv. v. vi. Given in the dataset: 1.
- Page 199 and 200:
Conversion from −3 −1 g N m d t
- Page 201 and 202:
Convert From Multiply by Convert to
- Page 203 and 204:
Texture 4 Variable Count N* Mean St
- Page 205 and 206:
Texture 10 Variable Count N* Mean S
- Page 207 and 208:
Texture-Temperature-WFP-pH Code Equ
- Page 209 and 210:
09-15-25-09 Rdn = 0.0106688*OC + 0.
- Page 211 and 212:
Code Rdn - OC Code Rdn-WFP Code Rdn
- Page 213 and 214:
- Code Rdn - OC Code Rdn - pH Code
- Page 215 and 216:
- Code Rdn - OC Code Rdn - NO3 Conc
- Page 217 and 218:
Code Rdn - OC Code Rdn - pH 08-25-9
- Page 219 and 220:
REFERENCES Almasri, M. N., & Kaluar
- Page 221 and 222:
Fellows, C., Hunter, H., Eccleston,
- Page 223 and 224:
King, D., & Nedwell, D. B. (1985).
- Page 225 and 226:
Ozden, T., & Muhammetoglu, H. (2008
- Page 227 and 228:
Smith, R., Bohlke, J., Garabedian,
- Page 229 and 230:
Zhu, J., Liu, G., Han, Y., Zhang, Y