THE FLORIDA STATE UNIVERSITY ARTS AND SCIENCES ...
THE FLORIDA STATE UNIVERSITY ARTS AND SCIENCES ...
THE FLORIDA STATE UNIVERSITY ARTS AND SCIENCES ...
You also want an ePaper? Increase the reach of your titles
YUMPU automatically turns print PDFs into web optimized ePapers that Google loves.
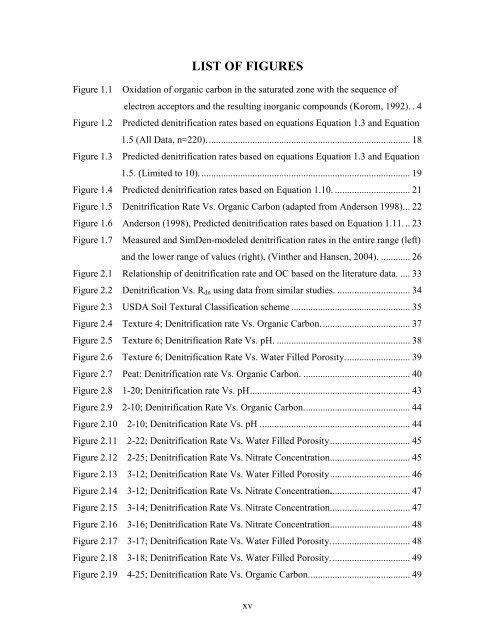
LIST OF FIGURES<br />
Figure 1.1 Oxidation of organic carbon in the saturated zone with the sequence of<br />
electron acceptors and the resulting inorganic compounds (Korom, 1992). . 4<br />
Figure 1.2 Predicted denitrification rates based on equations Equation 1.3 and Equation<br />
1.5 (All Data, n=220).................................................................................... 18<br />
Figure 1.3 Predicted denitrification rates based on equations Equation 1.3 and Equation<br />
1.5. (Limited to 10). ...................................................................................... 19<br />
Figure 1.4 Predicted denitrification rates based on Equation 1.10. ............................... 21<br />
Figure 1.5 Denitrification Rate Vs. Organic Carbon (adapted from Anderson 1998)... 22<br />
Figure 1.6 Anderson (1998), Predicted denitrification rates based on Equation 1.11... 23<br />
Figure 1.7 Measured and SimDen-modeled denitrification rates in the entire range (left)<br />
and the lower range of values (right), (Vinther and Hansen, 2004). ............ 26<br />
Figure 2.1 Relationship of denitrification rate and OC based on the literature data. .... 33<br />
Figure 2.2 Denitrification Vs. Rdn using data from similar studies. .............................. 34<br />
Figure 2.3 USDA Soil Textural Classification scheme ................................................. 35<br />
Figure 2.4 Texture 4; Denitrification rate Vs. Organic Carbon..................................... 37<br />
Figure 2.5 Texture 6; Denitrification Rate Vs. pH. ....................................................... 38<br />
Figure 2.6 Texture 6; Denitrification Rate Vs. Water Filled Porosity........................... 39<br />
Figure 2.7 Peat: Denitrification rate Vs. Organic Carbon. ............................................ 40<br />
Figure 2.8 1-20; Denitrification rate Vs. pH.................................................................. 43<br />
Figure 2.9 2-10; Denitrification Rate Vs. Organic Carbon............................................ 44<br />
Figure 2.10 2-10; Denitrification Rate Vs. pH .............................................................. 44<br />
Figure 2.11 2-22; Denitrification Rate Vs. Water Filled Porosity................................. 45<br />
Figure 2.12 2-25; Denitrification Rate Vs. Nitrate Concentration................................. 45<br />
Figure 2.13 3-12; Denitrification Rate Vs. Water Filled Porosity................................. 46<br />
Figure 2.14 3-12; Denitrification Rate Vs. Nitrate Concentration................................. 47<br />
Figure 2.15 3-14; Denitrification Rate Vs. Nitrate Concentration................................. 47<br />
Figure 2.16 3-16; Denitrification Rate Vs. Nitrate Concentration................................. 48<br />
Figure 2.17 3-17; Denitrification Rate Vs. Water Filled Porosity................................. 48<br />
Figure 2.18 3-18; Denitrification Rate Vs. Water Filled Porosity................................. 49<br />
Figure 2.19 4-25; Denitrification Rate Vs. Organic Carbon.......................................... 49<br />
xv


