
Create successful ePaper yourself
Turn your PDF publications into a flip-book with our unique Google optimized e-Paper software.
DIRECTORS’ REPORT<br />
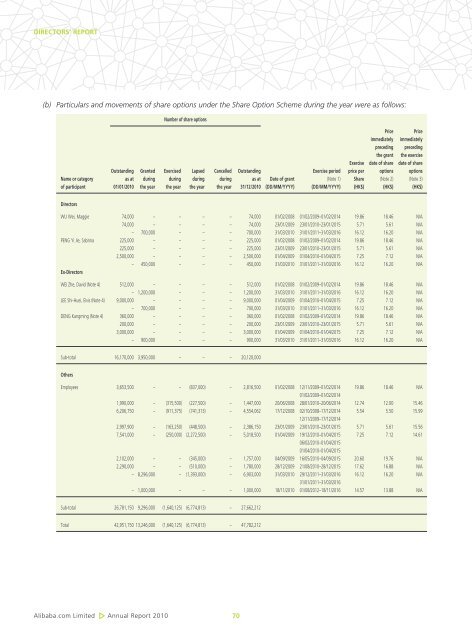
(b) Particulars and movements of share options under the Share Option Scheme during the year were as follows:<br />
<strong>Alibaba</strong>.com Limited Annual <strong>Report</strong> 2010<br />
Number of share options<br />
Price Price<br />
immediately immediately<br />
preceding preceding<br />
the grant the exercise<br />
Exercise date of share date of share<br />
Outstanding Granted Exercised Lapsed Cancelled Outstanding Exercise period price per options options<br />
Name or category as at during during during during as at Date of grant (Note 1) Share (Note 2) (Note 3)<br />
of participant 01/01/2010 the year the year the year the year 31/12/2010 (DD/MM/YYYY) (DD/MM/YYYY) (HK$) (HK$) (HK$)<br />
Directors<br />
WU Wei, Maggie 74,000 – – – – 74,000 01/02/2008 01/02/2009–01/02/2014 19.86 18.46 N/A<br />
74,000 – – – – 74,000 23/01/2009 23/01/2010–23/01/2015 5.71 5.61 N/A<br />
– 700,000 – – – 700,000 31/03/2010 31/01/2011–31/03/2016 16.12 16.20 N/A<br />
PENG Yi Jie, Sabrina 225,000 – – – – 225,000 01/02/2008 01/02/2009–01/02/2014 19.86 18.46 N/A<br />
225,000 – – – – 225,000 23/01/2009 23/01/2010–23/01/2015 5.71 5.61 N/A<br />
2,500,000 – – – – 2,500,000 01/04/2009 01/04/2010–01/04/2015 7.25 7.12 N/A<br />
– 450,000 – – – 450,000 31/03/2010 31/01/2011–31/03/2016 16.12 16.20 N/A<br />
Ex-Directors<br />
WEI Zhe, David (Note 4) 512,000 – – – – 512,000 01/02/2008 01/02/2009–01/02/2014 19.86 18.46 N/A<br />
– 1,200,000 – – – 1,200,000 31/03/2010 31/01/2011–31/03/2016 16.12 16.20 N/A<br />
LEE Shi-Huei, Elvis (Note 4) 9,000,000 – – – – 9,000,000 01/04/2009 01/04/2010–01/04/2015 7.25 7.12 N/A<br />
– 700,000 – – – 700,000 31/03/2010 31/01/2011–31/03/2016 16.12 16.20 N/A<br />
DENG Kangming (Note 4) 360,000 – – – – 360,000 01/02/2008 01/02/2009–01/02/2014 19.86 18.46 N/A<br />
200,000 – – – – 200,000 23/01/2009 23/01/2010–23/01/2015 5.71 5.61 N/A<br />
3,000,000 – – – – 3,000,000 01/04/2009 01/04/2010–01/04/2015 7.25 7.12 N/A<br />
– 900,000 – – – 900,000 31/03/2010 31/01/2011–31/03/2016 16.12 16.20 N/A<br />
Sub-total 16,170,000 3,950,000 – – – 20,120,000<br />
Others<br />
Employees 3,653,500 – – (837,000) – 2,816,500 01/02/2008 12/11/2009–01/02/2014 19.86 18.46 N/A<br />
01/02/2009–01/02/2014<br />
1,990,000 – (315,500) (227,500) – 1,447,000 20/06/2008 28/01/2010–20/06/2014 12.74 12.00 15.46<br />
6,206,750 – (911,375) (741,313) – 4,554,062 17/12/2008 02/10/2008–17/12/2014 5.54 5.50 15.99<br />
12/11/2009–17/12/2014<br />
2,997,900 – (163,250) (448,500) – 2,386,150 23/01/2009 23/01/2010–23/01/2015 5.71 5.61 15.56<br />
7,541,000 – (250,000) (2,272,500) – 5,018,500 01/04/2009 19/12/2010–01/04/2015 7.25 7.12 14.61<br />
06/02/2010–01/04/2015<br />
01/04/2010–01/04/2015<br />
2,102,000 – – (345,000) – 1,757,000 04/09/2009 16/05/2010–04/09/2015 20.60 19.76 N/A<br />
2,290,000 – – (510,000) – 1,780,000 28/12/2009 21/08/2010–28/12/2015 17.62 16.88 N/A<br />
– 8,296,000 – (1,393,000) – 6,903,000 31/03/2010 29/12/2011–31/03/2016 16.12 16.20 N/A<br />
31/01/2011–31/03/2016<br />
– 1,000,000 – – – 1,000,000 18/11/2010 01/08/2012–18/11/2016 14.57 13.88 N/A<br />
Sub-total 26,781,150 9,296,000 (1,640,125) (6,774,813) – 27,662,212<br />
Total 42,951,150 13,246,000 (1,640,125) (6,774,813) – 47,782,212<br />
70