
Create successful ePaper yourself
Turn your PDF publications into a flip-book with our unique Google optimized e-Paper software.
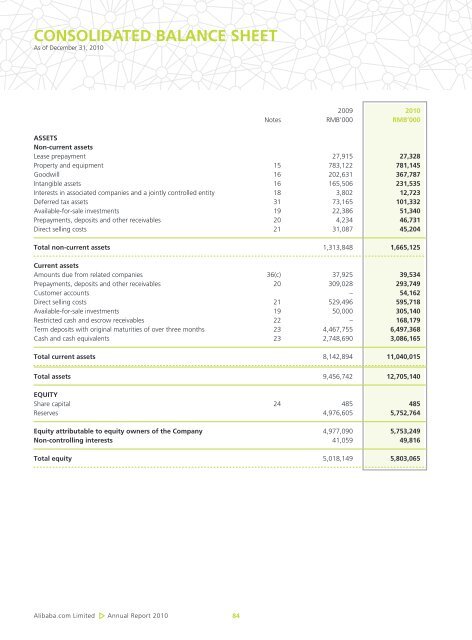
CONSOLIDATED BALANCE SHEET<br />
As of December 31, 2010<br />
<strong>Alibaba</strong>.com Limited Annual <strong>Report</strong> 2010<br />
84<br />
2009 2010<br />
Notes RMB’000 RMB’000<br />
ASSETS<br />
Non-current assets<br />
Lease prepayment 27,915 27,328<br />
Property and equipment 15 783,122 781,145<br />
Goodwill 16 202,631 367,787<br />
Intangible assets 16 165,506 231,535<br />
Interests in associated companies and a jointly controlled entity 18 3,802 12,723<br />
Deferred tax assets 31 73,165 101,332<br />
Available-for-sale investments 19 22,386 51,340<br />
Prepayments, deposits and other receivables 20 4,234 46,731<br />
Direct selling costs 21 31,087 45,204<br />
Total non-current assets 1,313,848 1,665,125<br />
Current assets<br />
Amounts due from related companies 36(c) 37,925 39,534<br />
Prepayments, deposits and other receivables 20 309,028 293,749<br />
Customer accounts – 54,162<br />
Direct selling costs 21 529,496 595,718<br />
Available-for-sale investments 19 50,000 305,140<br />
Restricted cash and escrow receivables 22 – 168,179<br />
Term deposits with original maturities of over three months 23 4,467,755 6,497,368<br />
Cash and cash equivalents 23 2,748,690 3,086,165<br />
Total current assets 8,142,894 11,040,015<br />
Total assets 9,456,742 12,705,140<br />
EQUITY<br />
Share capital 24 485 485<br />
Reserves 4,976,605 5,752,764<br />
Equity attributable to equity owners of the Company 4,977,090 5,753,249<br />
Non-controlling interests 41,059 49,816<br />
Total equity 5,018,149 5,803,065