

Biomass Energy Data Book: Edition 4 - Full Document - Center for ...
Biomass Energy Data Book: Edition 4 - Full Document - Center for ...
Biomass Energy Data Book: Edition 4 - Full Document - Center for ...

You also want an ePaper? Increase the reach of your titles
YUMPU automatically turns print PDFs into web optimized ePapers that Google loves.
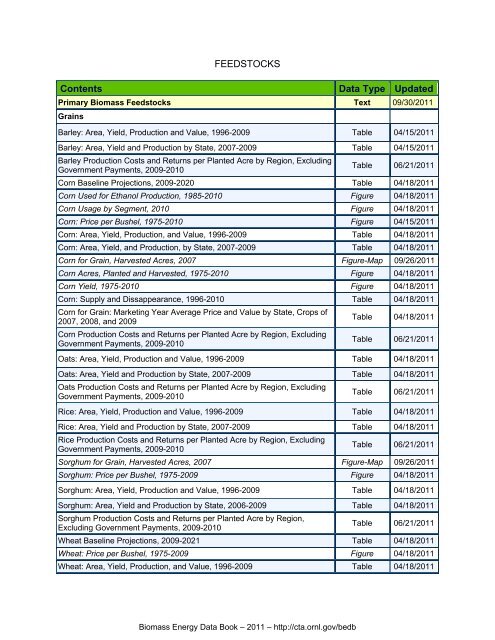
FEEDSTOCKS<br />
Contents <strong>Data</strong> Type Updated<br />
Primary <strong>Biomass</strong> Feedstocks Text 09/30/2011<br />
Grains<br />
Barley: Area, Yield, Production and Value, 1996-2009 Table 04/15/2011<br />
Barley: Area, Yield and Production by State, 2007-2009 Table 04/15/2011<br />
Barley Production Costs and Returns per Planted Acre by Region, Excluding<br />
Government Payments, 2009-2010<br />
Table 06/21/2011<br />
Corn Baseline Projections, 2009-2020 Table 04/18/2011<br />
Corn Used <strong>for</strong> Ethanol Production, 1985-2010 Figure 04/18/2011<br />
Corn Usage by Segment, 2010 Figure 04/18/2011<br />
Corn: Price per Bushel, 1975-2010 Figure 04/15/2011<br />
Corn: Area, Yield, Production, and Value, 1996-2009 Table 04/18/2011<br />
Corn: Area, Yield, and Production, by State, 2007-2009 Table 04/18/2011<br />
Corn <strong>for</strong> Grain, Harvested Acres, 2007 Figure-Map 09/26/2011<br />
Corn Acres, Planted and Harvested, 1975-2010 Figure 04/18/2011<br />
Corn Yield, 1975-2010 Figure 04/18/2011<br />
Corn: Supply and Dissappearance, 1996-2010 Table 04/18/2011<br />
Corn <strong>for</strong> Grain: Marketing Year Average Price and Value by State, Crops of<br />
2007, 2008, and 2009<br />
Corn Production Costs and Returns per Planted Acre by Region, Excluding<br />
Government Payments, 2009-2010<br />
Table 04/18/2011<br />
Table 06/21/2011<br />
Oats: Area, Yield, Production and Value, 1996-2009 Table 04/18/2011<br />
Oats: Area, Yield and Production by State, 2007-2009 Table 04/18/2011<br />
Oats Production Costs and Returns per Planted Acre by Region, Excluding<br />
Government Payments, 2009-2010<br />
Table 06/21/2011<br />
Rice: Area, Yield, Production and Value, 1996-2009 Table 04/18/2011<br />
Rice: Area, Yield and Production by State, 2007-2009 Table 04/18/2011<br />
Rice Production Costs and Returns per Planted Acre by Region, Excluding<br />
Government Payments, 2009-2010<br />
Table 06/21/2011<br />
Sorghum <strong>for</strong> Grain, Harvested Acres, 2007 Figure-Map 09/26/2011<br />
Sorghum: Price per Bushel, 1975-2009 Figure 04/18/2011<br />
Sorghum: Area, Yield, Production and Value, 1996-2009 Table 04/18/2011<br />
Sorghum: Area, Yield and Production by State, 2006-2009 Table 04/18/2011<br />
Sorghum Production Costs and Returns per Planted Acre by Region,<br />
Excluding Government Payments, 2009-2010<br />
Table 06/21/2011<br />
Wheat Baseline Projections, 2009-2021 Table 04/18/2011<br />
Wheat: Price per Bushel, 1975-2009 Figure 04/18/2011<br />
Wheat: Area, Yield, Production, and Value, 1996-2009 Table 04/18/2011<br />
<strong>Biomass</strong> <strong>Energy</strong> <strong>Data</strong> <strong>Book</strong> – 2011 – http://cta.ornl.gov/bedb


