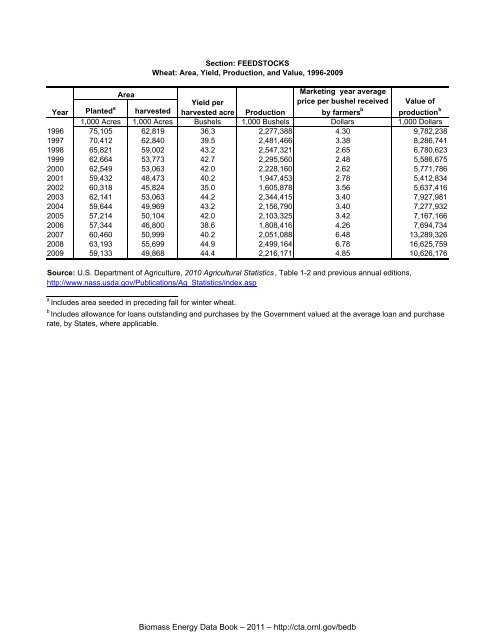
Planted a Year harvested Marketing year average price per bushel received by farmers 1,000 Acres 1,000 Acres Bushels 1,000 Bushels Dollars 1,000 Dollars 1996 75,105 62,819 36.3 2,277,388 4.30 9,782,238 1997 70,412 62,840 39.5 2,481,466 3.38 8,286,741 1998 65,821 59,002 43.2 2,547,321 2.65 6,780,623 1999 62,664 53,773 42.7 2,295,560 2.48 5,586,675 2000 62,549 53,063 42.0 2,228,160 2.62 5,771,786 2001 59,432 48,473 40.2 1,947,453 2.78 5,412,834 2002 60,318 45,824 35.0 1,605,878 3.56 5,637,416 2003 62,141 53,063 44.2 2,344,415 3.40 7,927,981 2004 59,644 49,969 43.2 2,156,790 3.40 7,277,932 2005 57,214 50,104 42.0 2,103,325 3.42 7,167,166 2006 57,344 46,800 38.6 1,808,416 4.26 7,694,734 2007 60,460 50,999 40.2 2,051,088 6.48 13,289,326 2008 63,193 55,699 44.9 2,499,164 6.78 16,625,759 2009 59,133 49,868 44.4 2,216,171 4.85 10,626,176 b Area Yield per harvested acre Production Value of production b Source: U.S. Department of Agriculture, 2010 Agricultural Statistics , Table 1-2 and previous annual editions, http://www.nass.usda.gov/Publications/Ag_Statistics/index.asp a Includes area seeded in preceding fall <strong>for</strong> winter wheat. b Includes allowance <strong>for</strong> loans outstanding and purchases by the Government valued at the average loan and purchase rate, by States, where applicable. Section: FEEDSTOCKS Wheat: Area, Yield, Production, and Value, 1996-2009 <strong>Biomass</strong> <strong>Energy</strong> <strong>Data</strong> <strong>Book</strong> – 2011 – http://cta.ornl.gov/bedb
2007 Area planted 2008 2009 2007 2008 2009 2007 2008 2009 2007 2008 2009 1,000 1,000 1,000 1,000 1,000 1,000 1,000 1,000 1,000 Acres Acres Acres Acres Acres Acres Bushels Bushels Bushels Bushels Bushels Bushels Alabama 120 240 220 76 200 180 42.0 71.0 55.0 3,192 14,200 9,900 Arizona 89 159 132 86 155 129 101.4 97.9 99.4 8,724 15,172 12,825 Arkansas 820 1070 430 700 980 390 41.0 57.0 44.0 28,700 55,860 17,160 Cali<strong>for</strong>nia 640 840 770 345 545 485 85.4 90.3 87.0 29,465 49,225 42,200 Colorado 2,520 2,190 2,630 2,369 1,936 2,479 39.2 30.8 40.6 92,980 59,700 100,610 Delaware 57 80 70 55 79 67 68.0 77.0 62.0 3,740 6 4,154 Florida 13 25 17 9 23 14 55.0 55.0 43.0 495 1,265 602 Georgia 360 480 340 230 400 250 40.0 56.0 42.0 9,200 22,400 10,500 Idaho 1,235 1,400 1,310 1,175 1,330 1,250 71.2 73.8 79.3 83,645 98,170 99,130 Illinois 1,000 1,200 850 890 1,150 820 55.0 64.0 56.0 48,950 73,600 45,920 Indiana 420 580 470 370 560 450 56.0 69.0 67.0 20,720 38,640 30,150 Iowa 35 40 28 28 35 22 48.0 48.0 45.0 1,344 1,680 990 Kansas 10,400 9,600 9,300 8,600 8,900 8,800 33.0 40.0 42.0 283,800 356,000 369,600 Kentucky 440 580 510 250 460 390 48.0 71.0 57.0 12,000 32,660 22,230 Louisiana 235 400 185 220 385 175 54.0 57.0 56.0 11,880 21,945 9,800 Maryland 220 255 230 160 180 195 66.0 73.0 60.0 10,560 13,140 11,700 Michigan 550 730 620 530 710 560 65.0 69.0 69.0 34,450 48,990 38,640 Minnesota 1,765 1,925 1,655 1,710 1,870 1,595 47.9 55.9 52.8 81,900 104,440 84,175 Mississippi 370 520 180 330 485 165 56.0 62.0 50.0 18,480 30,070 8,250 Missouri 1,050 1,250 780 880 1,160 730 43.0 48.0 47.0 37,840 55,680 34,310 Montana 5,170 5,740 5,520 5,065 5,470 5,305 29.6 30.1 33.3 149,820 164,730 176,625 Nebraska 2,050 1,750 1,700 1,960 1,670 1,600 43.0 44.0 48.0 84,280 73,480 76,800 Nevada 23 21 20 13 11 13 99.2 100.1 97.8 1,290 1,101 1,272 New Jersey 31 35 34 28 33 29 51.0 61.0 51.0 1,428 2,013 1,479 New Mexico 490 430 450 300 140 140 28.0 30.0 25.0 8,400 4 3,500 New York 100 130 115 85 122 105 53.0 63.0 65.0 4,505 7,686 6,825 North Carolina 630 820 700 500 720 600 40.0 60.0 49.0 20,000 43,200 29,400 North Dakota 8,595 9,230 8,680 8,405 8,640 8,415 35.6 36.0 44.8 298,875 311,200 377,190 Ohio 820 1,120 1,010 730 1,090 980 61.0 68.0 72.0 44,530 74 70,560 Oklahoma 5,900 5,600 5,700 3,500 4,500 3,500 28.0 37.0 22.0 98,000 166,500 77,000 Oregon 855 960 890 835 945 877 52.3 55.7 55.7 43,680 52,600 48,858 Pennsylvania 170 195 190 155 185 175 58.0 64.0 56.0 8,990 11,840 9,800 South Carolina 160 220 165 135 205 150 30.0 54.0 47.0 4,050 11,070 7,050 South Dakota 3,508 3,661 3,209 3,327 3,420 3,009 43.1 50.5 42.9 143,515 172,540 129,147 Tennessee 420 620 430 260 520 340 41.0 63.0 51.0 10,660 32,760 17,340 Texas 6,200 5,800 6,400 3,800 3,300 2,450 37.0 30.0 25.0 140,600 99,000 61,250 Utah 146 150 154 132 139 147 42.8 41.4 49.5 5,656 5,756 7,278 Virginia 230 310 250 205 280 210 64.0 71.0 58.0 13,120 19,880 12,180 Washington 2,170 2,290 2,290 2,137 2,255 2,225 58.7 52.7 55.3 125,342 118,790 123,085 West Virginia 8 11 9 6 8 5 57.0 60.0 50.0 342 480 250 Wisconsin 299 373 335 278 357 315 67.1 64.5 68.0 18,640 23,012 21,420 Wyoming 146 163 155 130 146 132 25.4 29.4 38.0 3,300 4,286 5,016 US 60,460 63,193 59,133 50,999 55,699 49,868 40.2 44.9 44.4 2,051,088 2,499,164 2,216,171 a State Area harvested Yield per harvested acre Production Source: U.S. Department of Agriculture, 2010 Agricultural Statistics, Table 1-6, http://www.nass.usda.gov/Publications/Ag_Statistics/index.asp a Includes area planted preceding fall. Section: FEEDSTOCKS Wheat: Area, Yield, and Production, by State, 2007-2009 <strong>Biomass</strong> <strong>Energy</strong> <strong>Data</strong> <strong>Book</strong> – 2011 – http://cta.ornl.gov/bedb
- Page 2 and 3:
USEFUL WEB SITES GOVERNMENT LINKS U
- Page 4 and 5:
Users of the Biomass Energy Data B
- Page 6 and 7:
PREFACE The Department of Energy, t
- Page 8 and 9:
INTRODUCTION TO BIOMASS Contents Da
- Page 10 and 11:
Legislation passed in December 2007
- Page 12 and 13:
Natural Gas Plant Nuclear Electric
- Page 14 and 15:
Biofuels, which are produced mainly
- Page 16 and 17:
In 2010, biomass accounted for abou
- Page 18 and 19:
Biomass is the single largest sourc
- Page 20 and 21:
Life-cycle analyses (LCAs) are anot
- Page 22 and 23:
Indirect Land-Use Change - The Issu
- Page 24 and 25:
Greenhouse gas emissions are one of
- Page 26 and 27:
potential energy crop supplies vary
- Page 28 and 29:
In 2007, the United States had a to
- Page 30 and 31:
Section: INTRODUCTION Geographic Lo
- Page 32 and 33:
Section: INTRODUCTION Geographic Lo
- Page 34 and 35:
Currently used biomass feedstocks a
- Page 36 and 37:
BIOFUELS Contents Data Type Updated
- Page 38 and 39:
Biofuels Overview A variety of fuel
- Page 40 and 41:
Section: BIOFUELS Diagram of Routes
- Page 42 and 43:
Ethanol Overview There are two type
- Page 44 and 45:
Property Ethanol Gasoline No. 2 Die
- Page 46 and 47:
Fuel ethanol production has been on
- Page 48 and 49:
Although ethanol can be made from a
- Page 50 and 51:
With increased blending of ethanol
- Page 52 and 53:
The mash is processed in a high-tem
- Page 54 and 55:
4. Cellulose Hydrolysis. In this st
- Page 56 and 57:
Ethanol is used as an oxygenate, bl
- Page 58 and 59:
The net energy balance and greenhou
- Page 60 and 61:
This figure shows the fossil energy
- Page 62 and 63:
The GREET model was developed by Ar
- Page 64 and 65:
Biodiesel Overview Biodiesel is a c
- Page 66 and 67:
SECTION: BIOFUELS Biodiesel Product
- Page 68 and 69:
SECTION: BIOFUELS Biodiesel Product
- Page 70 and 71:
Section: BIOFUELS Typical Proportio
- Page 72 and 73:
Property Test Method B6 to B20 S15
- Page 74 and 75:
The results of a study conducted by
- Page 76 and 77:
Pyrolysis is thermal decomposition
- Page 78 and 79:
Bio-oil is a liquid fuel made from
- Page 80 and 81:
Section: BIOFUELS Annotated Summary
- Page 82 and 83:
BIOPOWER Contents Data Type Updated
- Page 84 and 85:
Technology Category Biomass Convers
- Page 86 and 87:
Reburning with Wood Fuels for NOx M
- Page 88 and 89:
Fuel And EIA Fuel Code Emissions Un
- Page 90 and 91:
For the purpose of agricultural soi
- Page 92 and 93:
There are three distinct markets fo
- Page 94 and 95:
There are a growing number of utili
- Page 96 and 97:
Utility Green Pricing Programs Usin
- Page 98 and 99:
Utility Green Pricing Programs Usin
- Page 100 and 101:
Competitive Electricity Markets Ret
- Page 102 and 103:
Number of New Biomass Plants Megawa
- Page 104 and 105:
Current Biomass Power Plants (Conti
- Page 106 and 107:
New Plants Megawatts 100 90 80 70 6
- Page 108 and 109:
Current Landfill Gas Power Plants (
- Page 110 and 111:
Current Landfill Gas Power Plants (
- Page 112 and 113:
Current Landfill Gas Power Plants (
- Page 114 and 115:
Current Landfill Gas Power Plants (
- Page 116 and 117: New Plants Megawatts 35 30 25 20 15
- Page 118 and 119: Current Municipal Solid Waste Power
- Page 120 and 121: Green Pricing Programs, which allow
- Page 122 and 123: Section: BIOPOWER Coal Displacement
- Page 124 and 125: Section: BIOPOWER Number of Home El
- Page 126 and 127: Biorefineries Overview As a petrole
- Page 128 and 129: Below are nineteen projects relevan
- Page 130 and 131: Section: BIOREFINERIES Integrated B
- Page 132 and 133: SECTION: BIOREFINERIES Integrated B
- Page 134 and 135: FEEDSTOCKS Contents Data Type Updat
- Page 136 and 137: Pellet and Cordwood Appliance Shipm
- Page 138 and 139: Year Planted a Harvested 1,000 Acre
- Page 140 and 141: Item Gross value of production 2009
- Page 142 and 143: The figure below shows that corn us
- Page 144 and 145: Overall, the price for corn has bee
- Page 146 and 147: Production of sufficient quantities
- Page 148 and 149: Due largely to increased ethanol de
- Page 150 and 151: Production of food for domestic liv
- Page 152 and 153: These data show that government sub
- Page 154 and 155: 2007 2008 2009 2007 2008 2009 2007
- Page 156 and 157: Year Area Planted Harvested Section
- Page 158 and 159: Item Gross value of production 2009
- Page 160 and 161: The price for sorghum declined from
- Page 162 and 163: Sorghum is used for ethanol product
- Page 164 and 165: Item 2009/10 2010/11 2011/12 2012/1
- Page 168 and 169: Supply Section: FEEDSTOCKS Wheat: S
- Page 170 and 171: Item Gross value of production 2009
- Page 172 and 173: Camelina can be grown under margina
- Page 174 and 175: 2007 2008 2009 b 2007 2008 2009 b 2
- Page 176 and 177: USDA's 2008 soybean baseline projec
- Page 178 and 179: Year Area Planted Section: FEEDSTOC
- Page 180 and 181: In 2006, soybean stocks and product
- Page 182 and 183: Soybean production area is similar
- Page 184 and 185: Using algae as a feedstock for biof
- Page 186 and 187: Logging residues are the unused por
- Page 188 and 189: Forest residue thinnings are the ma
- Page 190 and 191: The Forest Service's State and Priv
- Page 192 and 193: The map below showing feedlot capac
- Page 194 and 195: Although the mill residues shown in
- Page 196 and 197: Shipments of cordwood appliances ha
- Page 198 and 199: Construction and demolition produce
- Page 200 and 201: Appendix A - Conversions Contents D
- Page 202 and 203: Section: Appendix A Heat Content Ra
- Page 204 and 205: The Effect of Moisture on Heating V
- Page 206 and 207: Measured Moisture, Elements, and Hi
- Page 208 and 209: List and Definition of Symbols Symb
- Page 210 and 211: Section: Appendix A Estimation of B
- Page 212 and 213: Section: Appendix A Stand Level Bio
- Page 214 and 215: The conversions in this table are o
- Page 216 and 217:
Section: Appendix A Estimating Tons
- Page 218 and 219:
Mass Section: Appendix A Mass Units
- Page 220 and 221:
Capacity and Volume 1 U.S. gallon (
- Page 222 and 223:
FROM: MJ J k W h Btu IT cal IT mega
- Page 224 and 225:
Section: Appendix A Alternative Mea
- Page 226 and 227:
Section: Appendix A SI Prefixes and
- Page 228 and 229:
Section: Appendix A Cost per Unit C
- Page 230 and 231:
Bioenergy Feedstocks Liquid Biofuel
- Page 232 and 233:
Bioenergy Feedstocks Liquid Biofuel
- Page 234 and 235:
Avoided costs - An investment guide
- Page 236 and 237:
Bulk density - Weight per unit of v
- Page 238 and 239:
harvested and cropland left idle al
- Page 240 and 241:
Feller-buncher - A self-propelled m
- Page 242 and 243:
Gasifier - A device for converting
- Page 244 and 245:
Horsepower - (electrical horsepower
- Page 246 and 247:
Moisture content - (MC) The weight
- Page 248 and 249:
Photosynthesis - Process by which c
- Page 250 and 251:
Reserve margin - The amount by whic
- Page 252 and 253:
Sustainable - An ecosystem conditio
- Page 254:
Waste streams - Unused solid or liq