

Biomass Energy Data Book: Edition 4 - Full Document - Center for ...
Biomass Energy Data Book: Edition 4 - Full Document - Center for ...
Biomass Energy Data Book: Edition 4 - Full Document - Center for ...

Create successful ePaper yourself
Turn your PDF publications into a flip-book with our unique Google optimized e-Paper software.
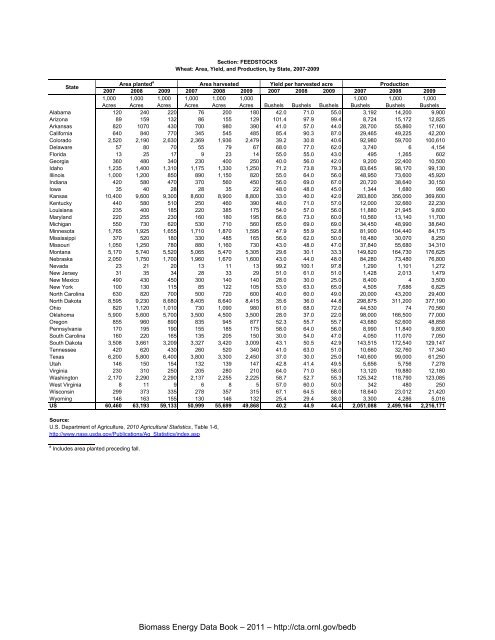
2007<br />
Area planted<br />
2008 2009 2007 2008 2009 2007 2008 2009 2007 2008 2009<br />
1,000 1,000 1,000 1,000 1,000 1,000<br />
1,000 1,000 1,000<br />
Acres Acres Acres Acres Acres Acres Bushels Bushels Bushels Bushels Bushels Bushels<br />
Alabama 120 240 220 76 200 180 42.0 71.0 55.0 3,192 14,200 9,900<br />
Arizona 89 159 132 86 155 129 101.4 97.9 99.4 8,724 15,172 12,825<br />
Arkansas 820 1070 430 700 980 390 41.0 57.0 44.0 28,700 55,860 17,160<br />
Cali<strong>for</strong>nia 640 840 770 345 545 485 85.4 90.3 87.0 29,465 49,225 42,200<br />
Colorado 2,520 2,190 2,630 2,369 1,936 2,479 39.2 30.8 40.6 92,980 59,700 100,610<br />
Delaware 57 80 70 55 79 67 68.0 77.0 62.0 3,740 6 4,154<br />
Florida 13 25 17 9 23 14 55.0 55.0 43.0 495 1,265 602<br />
Georgia 360 480 340 230 400 250 40.0 56.0 42.0 9,200 22,400 10,500<br />
Idaho 1,235 1,400 1,310 1,175 1,330 1,250 71.2 73.8 79.3 83,645 98,170 99,130<br />
Illinois 1,000 1,200 850 890 1,150 820 55.0 64.0 56.0 48,950 73,600 45,920<br />
Indiana 420 580 470 370 560 450 56.0 69.0 67.0 20,720 38,640 30,150<br />
Iowa 35 40 28 28 35 22 48.0 48.0 45.0 1,344 1,680 990<br />
Kansas 10,400 9,600 9,300 8,600 8,900 8,800 33.0 40.0 42.0 283,800 356,000 369,600<br />
Kentucky 440 580 510 250 460 390 48.0 71.0 57.0 12,000 32,660 22,230<br />
Louisiana 235 400 185 220 385 175 54.0 57.0 56.0 11,880 21,945 9,800<br />
Maryland 220 255 230 160 180 195 66.0 73.0 60.0 10,560 13,140 11,700<br />
Michigan 550 730 620 530 710 560 65.0 69.0 69.0 34,450 48,990 38,640<br />
Minnesota 1,765 1,925 1,655 1,710 1,870 1,595 47.9 55.9 52.8 81,900 104,440 84,175<br />
Mississippi 370 520 180 330 485 165 56.0 62.0 50.0 18,480 30,070 8,250<br />
Missouri 1,050 1,250 780 880 1,160 730 43.0 48.0 47.0 37,840 55,680 34,310<br />
Montana 5,170 5,740 5,520 5,065 5,470 5,305 29.6 30.1 33.3 149,820 164,730 176,625<br />
Nebraska 2,050 1,750 1,700 1,960 1,670 1,600 43.0 44.0 48.0 84,280 73,480 76,800<br />
Nevada 23 21 20 13 11 13 99.2 100.1 97.8 1,290 1,101 1,272<br />
New Jersey 31 35 34 28 33 29 51.0 61.0 51.0 1,428 2,013 1,479<br />
New Mexico 490 430 450 300 140 140 28.0 30.0 25.0 8,400 4 3,500<br />
New York 100 130 115 85 122 105 53.0 63.0 65.0 4,505 7,686 6,825<br />
North Carolina 630 820 700 500 720 600 40.0 60.0 49.0 20,000 43,200 29,400<br />
North Dakota 8,595 9,230 8,680 8,405 8,640 8,415 35.6 36.0 44.8 298,875 311,200 377,190<br />
Ohio 820 1,120 1,010 730 1,090 980 61.0 68.0 72.0 44,530 74 70,560<br />
Oklahoma 5,900 5,600 5,700 3,500 4,500 3,500 28.0 37.0 22.0 98,000 166,500 77,000<br />
Oregon 855 960 890 835 945 877 52.3 55.7 55.7 43,680 52,600 48,858<br />
Pennsylvania 170 195 190 155 185 175 58.0 64.0 56.0 8,990 11,840 9,800<br />
South Carolina 160 220 165 135 205 150 30.0 54.0 47.0 4,050 11,070 7,050<br />
South Dakota 3,508 3,661 3,209 3,327 3,420 3,009 43.1 50.5 42.9 143,515 172,540 129,147<br />
Tennessee 420 620 430 260 520 340 41.0 63.0 51.0 10,660 32,760 17,340<br />
Texas 6,200 5,800 6,400 3,800 3,300 2,450 37.0 30.0 25.0 140,600 99,000 61,250<br />
Utah 146 150 154 132 139 147 42.8 41.4 49.5 5,656 5,756 7,278<br />
Virginia 230 310 250 205 280 210 64.0 71.0 58.0 13,120 19,880 12,180<br />
Washington 2,170 2,290 2,290 2,137 2,255 2,225 58.7 52.7 55.3 125,342 118,790 123,085<br />
West Virginia 8 11 9 6 8 5 57.0 60.0 50.0 342 480 250<br />
Wisconsin 299 373 335 278 357 315 67.1 64.5 68.0 18,640 23,012 21,420<br />
Wyoming 146 163 155 130 146 132 25.4 29.4 38.0 3,300 4,286 5,016<br />
US 60,460 63,193 59,133 50,999 55,699 49,868 40.2 44.9 44.4 2,051,088 2,499,164 2,216,171<br />
a<br />
State<br />
Area harvested Yield per harvested acre Production<br />
Source:<br />
U.S. Department of Agriculture, 2010 Agricultural Statistics, Table 1-6,<br />
http://www.nass.usda.gov/Publications/Ag_Statistics/index.asp<br />
a Includes area planted preceding fall.<br />
Section: FEEDSTOCKS<br />
Wheat: Area, Yield, and Production, by State, 2007-2009<br />
<strong>Biomass</strong> <strong>Energy</strong> <strong>Data</strong> <strong>Book</strong> – 2011 – http://cta.ornl.gov/bedb


