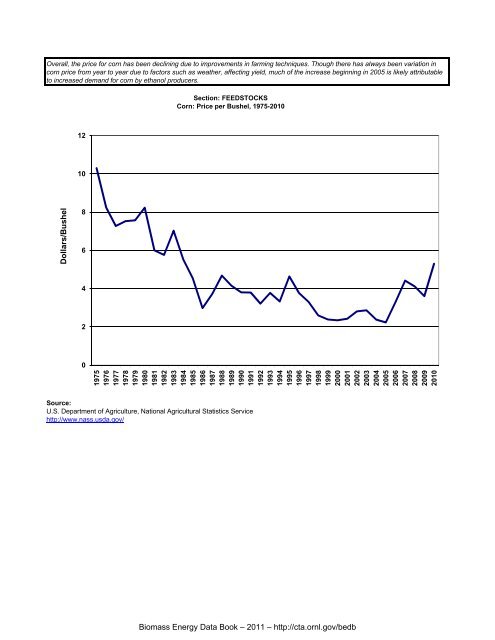
Overall, the price <strong>for</strong> corn has been declining due to improvements in farming techniques. Though there has always been variation in corn price from year to year due to factors such as weather, affecting yield, much of the increase beginning in 2005 is likely attributable to increased demand <strong>for</strong> corn by ethanol producers. Dollars/Bushel 12 10 8 6 4 2 0 Section: FEEDSTOCKS Corn: Price per Bushel, 1975-2010 (constant 2010 dollars) 1975 1976 1977 1978 1979 1980 1981 1982 1983 1984 1985 1986 1987 1988 1989 1990 1991 1992 1993 1994 1995 1996 1997 1998 1999 2000 2001 2002 2003 2004 2005 2006 2007 2008 2009 2010 Source: U.S. Department of Agriculture, National Agricultural Statistics Service http://www.nass.usda.gov/ <strong>Biomass</strong> <strong>Energy</strong> <strong>Data</strong> <strong>Book</strong> – 2011 – http://cta.ornl.gov/bedb
In the baseline year of 2001, 7.5% of all corn grain produced was used <strong>for</strong> ethanol production and by 2009 it rose to about 35%. Largely due to increased demand <strong>for</strong> ethanol, the acres of corn planted rose sharply in 2007 to 93 million acres but declined somewhat over the next two years; acreage variation is related to feed and export demands, crop subsidy programs, previous year grain prices and animal demand <strong>for</strong> silage. Yield variation relates to climate variation and improved varieties of corn. Year 1,000 Acres 1,000 Acres Bushels 1,000 Bushels Dollars 1,000 Dollars 1,000 Acres Tons 1,000 Tons 1996 79,229 72,644 127.1 9,232,557 2.71 25,149,013 5,607 15.4 86,581 1997 79,537 72,671 126.7 9,206,832 2.43 22,351,507 6,054 16.1 97,192 1998 80,165 72,589 134.4 9,758,685 1.94 18,922,084 5,913 16.1 95,479 1999 77,386 70,487 133.8 9,430,612 1.82 17,103,991 6,037 15.8 95,633 2000 79,551 72,440 136.9 9,915,051 1.85 18,499,002 6,082 16.8 102,156 2001 75,702 68,768 138.2 9,502,580 1.97 18,878,819 6,142 16.6 101,992 2002 78,894 69,330 129.3 8,966,787 2.32 20,882,448 7,122 14.4 102,293 2003 78,603 70,944 142.2 10,087,292 2.42 24,472,254 6,583 16.3 107,378 2004 80,929 73,631 160.3 11,805,581 2.06 24,377,913 6,101 17.6 107,293 2005 81,779 75,117 147.9 11,112,187 2.00 22,194,287 5,930 18.0 106,486 2006 78,327 70,638 149.1 10,531,123 3.04 32,083,011 6,487 16.2 105,129 2007 93,527 86,520 150.7 13,073,875 4.20 54,666,959 6,060 17.5 106,229 2008 85,982 78,570 153.9 12,091,648 4.06 49,312,615 5,965 18.7 111,619 2009 a 86,482 79,590 164.7 13,110,062 3.70 48,588,665 5,605 19.3 108,209 Source: U.S. Department of Agriculture, 2010 Agricultural Statistics , Table 1-35 and previous annual editions. http://www.nass.usda.gov/Publications/Ag_Statistics/index.asp a Preliminary Area Planted <strong>for</strong> all purposes Area harvested Section: FEEDSTOCKS Corn: Area, Yield, Production, and Value, 1996-2009 Yield per harvested acre Corn <strong>for</strong> grain Corn <strong>for</strong> silage Production Marketing year average price per bushel Value of production Area Harvested <strong>Biomass</strong> <strong>Energy</strong> <strong>Data</strong> <strong>Book</strong> – 2011 – http://cta.ornl.gov/bedb Yield per harvested acre Production
- Page 2 and 3:
USEFUL WEB SITES GOVERNMENT LINKS U
- Page 4 and 5:
Users of the Biomass Energy Data B
- Page 6 and 7:
PREFACE The Department of Energy, t
- Page 8 and 9:
INTRODUCTION TO BIOMASS Contents Da
- Page 10 and 11:
Legislation passed in December 2007
- Page 12 and 13:
Natural Gas Plant Nuclear Electric
- Page 14 and 15:
Biofuels, which are produced mainly
- Page 16 and 17:
In 2010, biomass accounted for abou
- Page 18 and 19:
Biomass is the single largest sourc
- Page 20 and 21:
Life-cycle analyses (LCAs) are anot
- Page 22 and 23:
Indirect Land-Use Change - The Issu
- Page 24 and 25:
Greenhouse gas emissions are one of
- Page 26 and 27:
potential energy crop supplies vary
- Page 28 and 29:
In 2007, the United States had a to
- Page 30 and 31:
Section: INTRODUCTION Geographic Lo
- Page 32 and 33:
Section: INTRODUCTION Geographic Lo
- Page 34 and 35:
Currently used biomass feedstocks a
- Page 36 and 37:
BIOFUELS Contents Data Type Updated
- Page 38 and 39:
Biofuels Overview A variety of fuel
- Page 40 and 41:
Section: BIOFUELS Diagram of Routes
- Page 42 and 43:
Ethanol Overview There are two type
- Page 44 and 45:
Property Ethanol Gasoline No. 2 Die
- Page 46 and 47:
Fuel ethanol production has been on
- Page 48 and 49:
Although ethanol can be made from a
- Page 50 and 51:
With increased blending of ethanol
- Page 52 and 53:
The mash is processed in a high-tem
- Page 54 and 55:
4. Cellulose Hydrolysis. In this st
- Page 56 and 57:
Ethanol is used as an oxygenate, bl
- Page 58 and 59:
The net energy balance and greenhou
- Page 60 and 61:
This figure shows the fossil energy
- Page 62 and 63:
The GREET model was developed by Ar
- Page 64 and 65:
Biodiesel Overview Biodiesel is a c
- Page 66 and 67:
SECTION: BIOFUELS Biodiesel Product
- Page 68 and 69:
SECTION: BIOFUELS Biodiesel Product
- Page 70 and 71:
Section: BIOFUELS Typical Proportio
- Page 72 and 73:
Property Test Method B6 to B20 S15
- Page 74 and 75:
The results of a study conducted by
- Page 76 and 77:
Pyrolysis is thermal decomposition
- Page 78 and 79:
Bio-oil is a liquid fuel made from
- Page 80 and 81:
Section: BIOFUELS Annotated Summary
- Page 82 and 83:
BIOPOWER Contents Data Type Updated
- Page 84 and 85:
Technology Category Biomass Convers
- Page 86 and 87:
Reburning with Wood Fuels for NOx M
- Page 88 and 89:
Fuel And EIA Fuel Code Emissions Un
- Page 90 and 91:
For the purpose of agricultural soi
- Page 92 and 93:
There are three distinct markets fo
- Page 94 and 95: There are a growing number of utili
- Page 96 and 97: Utility Green Pricing Programs Usin
- Page 98 and 99: Utility Green Pricing Programs Usin
- Page 100 and 101: Competitive Electricity Markets Ret
- Page 102 and 103: Number of New Biomass Plants Megawa
- Page 104 and 105: Current Biomass Power Plants (Conti
- Page 106 and 107: New Plants Megawatts 100 90 80 70 6
- Page 108 and 109: Current Landfill Gas Power Plants (
- Page 110 and 111: Current Landfill Gas Power Plants (
- Page 112 and 113: Current Landfill Gas Power Plants (
- Page 114 and 115: Current Landfill Gas Power Plants (
- Page 116 and 117: New Plants Megawatts 35 30 25 20 15
- Page 118 and 119: Current Municipal Solid Waste Power
- Page 120 and 121: Green Pricing Programs, which allow
- Page 122 and 123: Section: BIOPOWER Coal Displacement
- Page 124 and 125: Section: BIOPOWER Number of Home El
- Page 126 and 127: Biorefineries Overview As a petrole
- Page 128 and 129: Below are nineteen projects relevan
- Page 130 and 131: Section: BIOREFINERIES Integrated B
- Page 132 and 133: SECTION: BIOREFINERIES Integrated B
- Page 134 and 135: FEEDSTOCKS Contents Data Type Updat
- Page 136 and 137: Pellet and Cordwood Appliance Shipm
- Page 138 and 139: Year Planted a Harvested 1,000 Acre
- Page 140 and 141: Item Gross value of production 2009
- Page 142 and 143: The figure below shows that corn us
- Page 146 and 147: Production of sufficient quantities
- Page 148 and 149: Due largely to increased ethanol de
- Page 150 and 151: Production of food for domestic liv
- Page 152 and 153: These data show that government sub
- Page 154 and 155: 2007 2008 2009 2007 2008 2009 2007
- Page 156 and 157: Year Area Planted Harvested Section
- Page 158 and 159: Item Gross value of production 2009
- Page 160 and 161: The price for sorghum declined from
- Page 162 and 163: Sorghum is used for ethanol product
- Page 164 and 165: Item 2009/10 2010/11 2011/12 2012/1
- Page 166 and 167: Planted a Year harvested Marketing
- Page 168 and 169: Supply Section: FEEDSTOCKS Wheat: S
- Page 170 and 171: Item Gross value of production 2009
- Page 172 and 173: Camelina can be grown under margina
- Page 174 and 175: 2007 2008 2009 b 2007 2008 2009 b 2
- Page 176 and 177: USDA's 2008 soybean baseline projec
- Page 178 and 179: Year Area Planted Section: FEEDSTOC
- Page 180 and 181: In 2006, soybean stocks and product
- Page 182 and 183: Soybean production area is similar
- Page 184 and 185: Using algae as a feedstock for biof
- Page 186 and 187: Logging residues are the unused por
- Page 188 and 189: Forest residue thinnings are the ma
- Page 190 and 191: The Forest Service's State and Priv
- Page 192 and 193: The map below showing feedlot capac
- Page 194 and 195:
Although the mill residues shown in
- Page 196 and 197:
Shipments of cordwood appliances ha
- Page 198 and 199:
Construction and demolition produce
- Page 200 and 201:
Appendix A - Conversions Contents D
- Page 202 and 203:
Section: Appendix A Heat Content Ra
- Page 204 and 205:
The Effect of Moisture on Heating V
- Page 206 and 207:
Measured Moisture, Elements, and Hi
- Page 208 and 209:
List and Definition of Symbols Symb
- Page 210 and 211:
Section: Appendix A Estimation of B
- Page 212 and 213:
Section: Appendix A Stand Level Bio
- Page 214 and 215:
The conversions in this table are o
- Page 216 and 217:
Section: Appendix A Estimating Tons
- Page 218 and 219:
Mass Section: Appendix A Mass Units
- Page 220 and 221:
Capacity and Volume 1 U.S. gallon (
- Page 222 and 223:
FROM: MJ J k W h Btu IT cal IT mega
- Page 224 and 225:
Section: Appendix A Alternative Mea
- Page 226 and 227:
Section: Appendix A SI Prefixes and
- Page 228 and 229:
Section: Appendix A Cost per Unit C
- Page 230 and 231:
Bioenergy Feedstocks Liquid Biofuel
- Page 232 and 233:
Bioenergy Feedstocks Liquid Biofuel
- Page 234 and 235:
Avoided costs - An investment guide
- Page 236 and 237:
Bulk density - Weight per unit of v
- Page 238 and 239:
harvested and cropland left idle al
- Page 240 and 241:
Feller-buncher - A self-propelled m
- Page 242 and 243:
Gasifier - A device for converting
- Page 244 and 245:
Horsepower - (electrical horsepower
- Page 246 and 247:
Moisture content - (MC) The weight
- Page 248 and 249:
Photosynthesis - Process by which c
- Page 250 and 251:
Reserve margin - The amount by whic
- Page 252 and 253:
Sustainable - An ecosystem conditio
- Page 254:
Waste streams - Unused solid or liq