

Biomass Energy Data Book: Edition 4 - Full Document - Center for ...
Biomass Energy Data Book: Edition 4 - Full Document - Center for ...
Biomass Energy Data Book: Edition 4 - Full Document - Center for ...

Create successful ePaper yourself
Turn your PDF publications into a flip-book with our unique Google optimized e-Paper software.
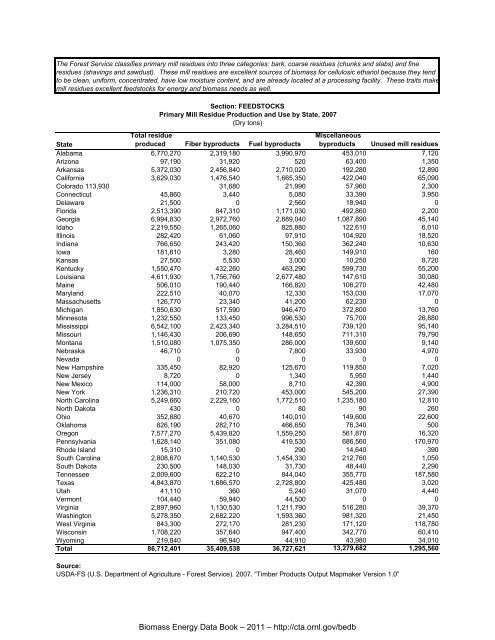
The Forest Service classifies primary mill residues into three categories: bark, coarse residues (chunks and slabs) and fine<br />
residues (shavings and sawdust). These mill residues are excellent sources of biomass <strong>for</strong> cellulosic ethanol because they tend<br />
to be clean, uni<strong>for</strong>m, concentrated, have low moisture content, and are already located at a processing facility. These traits make<br />
mill residues excellent feedstocks <strong>for</strong> energy and biomass needs as well.<br />
State<br />
Section: FEEDSTOCKS<br />
Primary Mill Residue Production and Use by State, 2007<br />
(Dry tons)<br />
Total residue<br />
produced Fiber byproducts Fuel byproducts<br />
Miscellaneous<br />
byproducts Unused mill residues<br />
Alabama 6,770,270 2,319,180 3,990,970 453,010 7,120<br />
Arizona 97,190 31,920 520 63,400 1,350<br />
Arkansas 5,372,030 2,456,840 2,710,020 192,280 12,890<br />
Cali<strong>for</strong>nia 3,629,030 1,476,540 1,665,350 422,040 65,090<br />
Colorado 113,930 31,680 21,990 57,960 2,300<br />
Connecticut 45,860 3,440 5,080 33,390 3,950<br />
Delaware 21,500 0 2,560 18,940 0<br />
Florida 2,513,390 847,310 1,171,030 492,860 2,200<br />
Georgia 6,994,830 2,972,760 2,889,040 1,087,890 45,140<br />
Idaho 2,219,550 1,265,060 825,880 122,610 6,010<br />
Illinois 282,420 61,060 97,910 104,920 18,520<br />
Indiana 766,650 243,420 150,360 362,240 10,630<br />
Iowa 181,810 3,280 28,460 149,910 160<br />
Kansas 27,500 5,530 3,000 10,250 8,720<br />
Kentucky 1,550,470 432,260 463,290 599,730 55,200<br />
Louisiana 4,611,930 1,756,760 2,677,480 147,610 30,080<br />
Maine 506,010 190,440 166,820 106,270 42,480<br />
Maryland 222,510 40,070 12,330 153,030 17,070<br />
Massachusetts 126,770 23,340 41,200 62,230 0<br />
Michigan 1,850,630 517,590 946,470 372,800 13,760<br />
Minnesota 1,232,550 133,450 996,530 75,700 26,880<br />
Mississippi 6,542,100 2,423,340 3,284,510 739,120 95,140<br />
Missouri 1,146,430 206,690 148,650 711,310 79,790<br />
Montana 1,510,080 1,075,350 286,000 139,600 9,140<br />
Nebraska 46,710 0 7,800 33,930 4,970<br />
Nevada 0 0 0 0 0<br />
New Hampshire 335,450 82,920 125,670 119,850 7,020<br />
New Jersey 8,720 0 1,340 5,950 1,440<br />
New Mexico 114,000 58,000 8,710 42,390 4,900<br />
New York 1,236,310 210,720 453,000 545,200 27,390<br />
North Carolina 5,249,660 2,229,160 1,772,510 1,235,180 12,810<br />
North Dakota 430 0 80 90 260<br />
Ohio 352,880 40,670 140,010 149,600 22,600<br />
Oklahoma 826,190 282,710 466,650 76,340 500<br />
Oregon 7,577,270 5,439,820 1,559,250 561,870 16,320<br />
Pennsylvania 1,628,140 351,080 419,530 686,560 170,970<br />
Rhode Island 15,310 0 290 14,640 390<br />
South Carolina 2,808,670 1,140,530 1,454,330 212,760 1,050<br />
South Dakota 230,500 148,030 31,730 48,440 2,290<br />
Tennessee 2,009,600 622,210 844,040 355,770 187,580<br />
Texas 4,843,870 1,686,570 2,728,800 425,480 3,020<br />
Utah 41,110 360 5,240 31,070 4,440<br />
Vermont 104,440 59,940 44,500 0 0<br />
Virginia 2,897,960 1,130,530 1,211,790 516,280 39,370<br />
Washington 5,278,350 2,682,220 1,593,360 981,320 21,450<br />
West Virginia 843,300 272,170 281,230 171,120 118,780<br />
Wisconsin 1,708,220 357,640 947,400 342,770 60,410<br />
Wyoming 219,840 96,940 44,910 43,980 34,010<br />
Total 86,712,401 35,409,538 36,727,621 13,279,682 1,295,560<br />
Source:<br />
USDA-FS (U.S. Department of Agriculture - Forest Service). 2007. “Timber Products Output Mapmaker Version 1.0”<br />
<strong>Biomass</strong> <strong>Energy</strong> <strong>Data</strong> <strong>Book</strong> – 2011 – http://cta.ornl.gov/bedb


