Production of sufficient quantities of corn to support ethanol production facilities occurs primarily in the mid-western states. Yields vary considerably across the states. High yields in the western states occur under irrigation. 2007 2008 2009 a 2007 2008 2009 a 2007 2008 2009 a Area planted <strong>for</strong> all purposes 2007 2008 2009 1,000 1,000 1,000 1,000 1,000 1,000 1,000 1,000 1,000 Acres Acres Acres Acres Acres Acres Bushels Bushels Bushels Bushels Bushels Bushels Alabama 340 260 280 280 235 250 78 104 108 21,840 24,440 27,000 Arizona 55 50 50 22 15 20 185 165 175 4,070 2,475 3,500 Arkansas 610 440 430 590 430 410 169 155 148 99,710 66,650 60,680 Cali<strong>for</strong>nia 650 670 550 190 170 160 182 195 180 34,580 33,150 28,800 Colorado 1,200 1,250 1,100 1,060 1,010 990 140 137 153 148,400 138,370 151,470 Connecticut 26 27 26 b b b b b b b b b Delaware 195 160 170 185 152 163 99 125 145 18,315 19,000 23,635 Florida 70 70 70 35 35 37 90 105 100 3,150 3,675 3,700 Georgia 510 370 420 450 310 370 127 140 140 57,150 43,400 51,800 Idaho 320 300 300 105 80 80 170 170 180 17,850 13,600 14,400 Illinois 13,200 12,100 12,000 13,050 11,900 11,800 175 179 174 2,283,750 2,130,100 2,053,200 Indiana 6,500 5,700 5,600 6,370 5,460 5,460 154 160 171 980,980 873,600 933,660 Iowa 14,200 13,300 13,700 13,900 12,800 13,400 171 171 182 2,376,900 2,188,800 2,438,800 Kansas 3,900 3,850 4,100 3,680 3,630 3,860 138 134 155 507,840 486,420 598,300 Kentucky 1,440 1,210 1,220 1,340 1,120 1,150 128 136 165 171,520 152,320 189,750 Louisiana 740 520 630 730 510 610 163 144 132 118,990 73,440 80,520 Maine 28 29 28 b b b b b b b b b Maryland 540 460 470 465 400 425 101 121 145 46,965 48,400 61,625 Massachusetts 18 19 17 b b b b b b b b b Michigan 2,650 2,400 2,350 2,340 2,140 2,070 123 138 148 287,820 295,320 309,320 Minnesota 8,400 7,700 7,600 7,850 7,200 7,150 146 164 174 1,146,100 1,180,800 1,244,100 Mississippi 930 720 730 910 700 695 148 140 126 134,680 98,000 87,570 Missouri 3,450 2,800 3,000 3,270 2,650 2,920 140 144 153 457,800 381,600 446,760 Montana 84 78 72 38 35 26 140 136 152 5,320 4,760 3,952 Nebraska 9,400 8,800 9,150 9,200 8,550 8,850 160 163 178 1,472,000 1,393,650 1,575,300 Nevada 5 5 4 b b b b b b b b b New Hampshire 14 15 15 b b b b b b b b b New Jersey 95 85 80 82 74 70 124 116 143 10,168 8,540 10,010 New Mexico 135 140 130 54 55 50 180 180 185 9,720 9,900 9,250 New York 1060 1,090 1,070 550 640 595 128 144 134 70,400 92,160 79,730 North Carolina 1090 900 870 1,010 830 800 100 78 117 101,000 64,740 93,600 North Dakota 2,560 2,550 1,950 2,350 2,300 1,740 116 124 115 272,600 285,200 200,100 Ohio 3,850 3,300 3,350 3,610 3,120 3,140 150 135 174 541,500 421,200 546,360 Oklahoma 320 370 390 270 320 320 145 115 105 39,150 36,800 33,600 Oregon 60 60 60 35 33 32 200 200 215 7,000 6,600 6,880 Pennsylvania 1,430 1,350 1,350 980 880 920 124 133 143 121,520 117,040 131,560 Rhode Island 2 2 2 b b b b b b b b b South Carolina 400 355 335 370 315 320 97 65 111 35,890 20,475 35,520 South Dakota 4,950 4,750 5,000 4,480 4,400 4,680 121 133 151 542,080 585,200 706,680 Tennessee 860 690 670 790 630 590 106 118 148 83,740 74,340 87,320 Texas 2,150 2,300 2,350 1,970 2,030 1,960 148 125 130 291,560 253,750 254,800 Utah 70 70 65 22 23 17 150 157 155 3,300 3,611 2,635 Vermont 92 94 91 b b b b b b b b b Virginia 540 470 480 405 340 330 86 108 131 34,830 36,720 43,230 Washington 195 165 170 115 90 105 210 205 215 24,150 18,450 22,575 West Virginia 48 43 47 27 26 30 111 130 126 2,997 3,380 3,780 Wisconsin 4,050 3,800 3,850 3,280 2,880 2,930 135 137 153 442,800 394,560 448,290 Wyoming 95 95 90 60 52 45 129 134 140 7,740 6,968 6,300 US 93,527 85,982 86,482 86,520 78,570 795,920 150.7 153.9 164.7 13,037,875 12,091,648 13,110,062 a Corn <strong>for</strong> grain State Area harvested Yield per harvested acre Production Source: U.S. Department of Agriculture, 2010 Agricultural Statistics , Table 1-37, http://www.nass.usda.gov/Publications/Ag_Statistics/index.asp a Preliminary. b Not estimated. Section: FEEDSTOCKS Corn: Area, Yield, and Production, by State, 2007-2009 <strong>Biomass</strong> <strong>Energy</strong> <strong>Data</strong> <strong>Book</strong> – 2011 – http://cta.ornl.gov/bedb
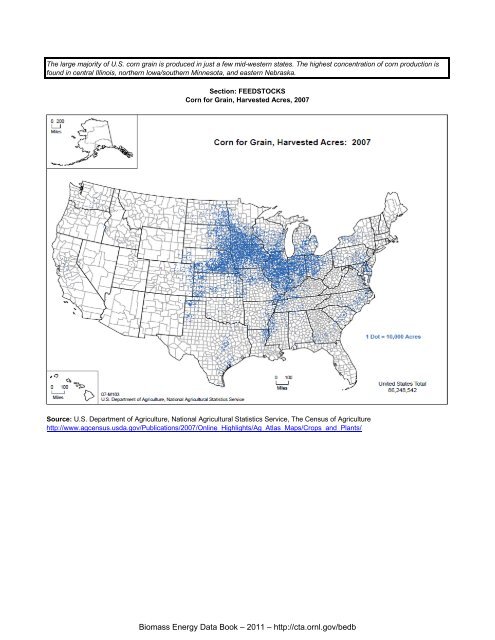
The large majority of U.S. corn grain is produced in just a few mid-western states. The highest concentration of corn production is found in central Illinois, northern Iowa/southern Minnesota, and eastern Nebraska. Section: FEEDSTOCKS Corn <strong>for</strong> Grain, Harvested Acres, 2007 Source: U.S. Department of Agriculture, National Agricultural Statistics Service, The Census of Agriculture http://www.agcensus.usda.gov/Publications/2007/Online_Highlights/Ag_Atlas_Maps/Crops_and_Plants/ <strong>Biomass</strong> <strong>Energy</strong> <strong>Data</strong> <strong>Book</strong> – 2011 – http://cta.ornl.gov/bedb
- Page 2 and 3:
USEFUL WEB SITES GOVERNMENT LINKS U
- Page 4 and 5:
Users of the Biomass Energy Data B
- Page 6 and 7:
PREFACE The Department of Energy, t
- Page 8 and 9:
INTRODUCTION TO BIOMASS Contents Da
- Page 10 and 11:
Legislation passed in December 2007
- Page 12 and 13:
Natural Gas Plant Nuclear Electric
- Page 14 and 15:
Biofuels, which are produced mainly
- Page 16 and 17:
In 2010, biomass accounted for abou
- Page 18 and 19:
Biomass is the single largest sourc
- Page 20 and 21:
Life-cycle analyses (LCAs) are anot
- Page 22 and 23:
Indirect Land-Use Change - The Issu
- Page 24 and 25:
Greenhouse gas emissions are one of
- Page 26 and 27:
potential energy crop supplies vary
- Page 28 and 29:
In 2007, the United States had a to
- Page 30 and 31:
Section: INTRODUCTION Geographic Lo
- Page 32 and 33:
Section: INTRODUCTION Geographic Lo
- Page 34 and 35:
Currently used biomass feedstocks a
- Page 36 and 37:
BIOFUELS Contents Data Type Updated
- Page 38 and 39:
Biofuels Overview A variety of fuel
- Page 40 and 41:
Section: BIOFUELS Diagram of Routes
- Page 42 and 43:
Ethanol Overview There are two type
- Page 44 and 45:
Property Ethanol Gasoline No. 2 Die
- Page 46 and 47:
Fuel ethanol production has been on
- Page 48 and 49:
Although ethanol can be made from a
- Page 50 and 51:
With increased blending of ethanol
- Page 52 and 53:
The mash is processed in a high-tem
- Page 54 and 55:
4. Cellulose Hydrolysis. In this st
- Page 56 and 57:
Ethanol is used as an oxygenate, bl
- Page 58 and 59:
The net energy balance and greenhou
- Page 60 and 61:
This figure shows the fossil energy
- Page 62 and 63:
The GREET model was developed by Ar
- Page 64 and 65:
Biodiesel Overview Biodiesel is a c
- Page 66 and 67:
SECTION: BIOFUELS Biodiesel Product
- Page 68 and 69:
SECTION: BIOFUELS Biodiesel Product
- Page 70 and 71:
Section: BIOFUELS Typical Proportio
- Page 72 and 73:
Property Test Method B6 to B20 S15
- Page 74 and 75:
The results of a study conducted by
- Page 76 and 77:
Pyrolysis is thermal decomposition
- Page 78 and 79:
Bio-oil is a liquid fuel made from
- Page 80 and 81:
Section: BIOFUELS Annotated Summary
- Page 82 and 83:
BIOPOWER Contents Data Type Updated
- Page 84 and 85:
Technology Category Biomass Convers
- Page 86 and 87:
Reburning with Wood Fuels for NOx M
- Page 88 and 89:
Fuel And EIA Fuel Code Emissions Un
- Page 90 and 91:
For the purpose of agricultural soi
- Page 92 and 93:
There are three distinct markets fo
- Page 94 and 95:
There are a growing number of utili
- Page 96 and 97: Utility Green Pricing Programs Usin
- Page 98 and 99: Utility Green Pricing Programs Usin
- Page 100 and 101: Competitive Electricity Markets Ret
- Page 102 and 103: Number of New Biomass Plants Megawa
- Page 104 and 105: Current Biomass Power Plants (Conti
- Page 106 and 107: New Plants Megawatts 100 90 80 70 6
- Page 108 and 109: Current Landfill Gas Power Plants (
- Page 110 and 111: Current Landfill Gas Power Plants (
- Page 112 and 113: Current Landfill Gas Power Plants (
- Page 114 and 115: Current Landfill Gas Power Plants (
- Page 116 and 117: New Plants Megawatts 35 30 25 20 15
- Page 118 and 119: Current Municipal Solid Waste Power
- Page 120 and 121: Green Pricing Programs, which allow
- Page 122 and 123: Section: BIOPOWER Coal Displacement
- Page 124 and 125: Section: BIOPOWER Number of Home El
- Page 126 and 127: Biorefineries Overview As a petrole
- Page 128 and 129: Below are nineteen projects relevan
- Page 130 and 131: Section: BIOREFINERIES Integrated B
- Page 132 and 133: SECTION: BIOREFINERIES Integrated B
- Page 134 and 135: FEEDSTOCKS Contents Data Type Updat
- Page 136 and 137: Pellet and Cordwood Appliance Shipm
- Page 138 and 139: Year Planted a Harvested 1,000 Acre
- Page 140 and 141: Item Gross value of production 2009
- Page 142 and 143: The figure below shows that corn us
- Page 144 and 145: Overall, the price for corn has bee
- Page 148 and 149: Due largely to increased ethanol de
- Page 150 and 151: Production of food for domestic liv
- Page 152 and 153: These data show that government sub
- Page 154 and 155: 2007 2008 2009 2007 2008 2009 2007
- Page 156 and 157: Year Area Planted Harvested Section
- Page 158 and 159: Item Gross value of production 2009
- Page 160 and 161: The price for sorghum declined from
- Page 162 and 163: Sorghum is used for ethanol product
- Page 164 and 165: Item 2009/10 2010/11 2011/12 2012/1
- Page 166 and 167: Planted a Year harvested Marketing
- Page 168 and 169: Supply Section: FEEDSTOCKS Wheat: S
- Page 170 and 171: Item Gross value of production 2009
- Page 172 and 173: Camelina can be grown under margina
- Page 174 and 175: 2007 2008 2009 b 2007 2008 2009 b 2
- Page 176 and 177: USDA's 2008 soybean baseline projec
- Page 178 and 179: Year Area Planted Section: FEEDSTOC
- Page 180 and 181: In 2006, soybean stocks and product
- Page 182 and 183: Soybean production area is similar
- Page 184 and 185: Using algae as a feedstock for biof
- Page 186 and 187: Logging residues are the unused por
- Page 188 and 189: Forest residue thinnings are the ma
- Page 190 and 191: The Forest Service's State and Priv
- Page 192 and 193: The map below showing feedlot capac
- Page 194 and 195: Although the mill residues shown in
- Page 196 and 197:
Shipments of cordwood appliances ha
- Page 198 and 199:
Construction and demolition produce
- Page 200 and 201:
Appendix A - Conversions Contents D
- Page 202 and 203:
Section: Appendix A Heat Content Ra
- Page 204 and 205:
The Effect of Moisture on Heating V
- Page 206 and 207:
Measured Moisture, Elements, and Hi
- Page 208 and 209:
List and Definition of Symbols Symb
- Page 210 and 211:
Section: Appendix A Estimation of B
- Page 212 and 213:
Section: Appendix A Stand Level Bio
- Page 214 and 215:
The conversions in this table are o
- Page 216 and 217:
Section: Appendix A Estimating Tons
- Page 218 and 219:
Mass Section: Appendix A Mass Units
- Page 220 and 221:
Capacity and Volume 1 U.S. gallon (
- Page 222 and 223:
FROM: MJ J k W h Btu IT cal IT mega
- Page 224 and 225:
Section: Appendix A Alternative Mea
- Page 226 and 227:
Section: Appendix A SI Prefixes and
- Page 228 and 229:
Section: Appendix A Cost per Unit C
- Page 230 and 231:
Bioenergy Feedstocks Liquid Biofuel
- Page 232 and 233:
Bioenergy Feedstocks Liquid Biofuel
- Page 234 and 235:
Avoided costs - An investment guide
- Page 236 and 237:
Bulk density - Weight per unit of v
- Page 238 and 239:
harvested and cropland left idle al
- Page 240 and 241:
Feller-buncher - A self-propelled m
- Page 242 and 243:
Gasifier - A device for converting
- Page 244 and 245:
Horsepower - (electrical horsepower
- Page 246 and 247:
Moisture content - (MC) The weight
- Page 248 and 249:
Photosynthesis - Process by which c
- Page 250 and 251:
Reserve margin - The amount by whic
- Page 252 and 253:
Sustainable - An ecosystem conditio
- Page 254:
Waste streams - Unused solid or liq