

Biomass Energy Data Book: Edition 4 - Full Document - Center for ...
Biomass Energy Data Book: Edition 4 - Full Document - Center for ...
Biomass Energy Data Book: Edition 4 - Full Document - Center for ...

Create successful ePaper yourself
Turn your PDF publications into a flip-book with our unique Google optimized e-Paper software.
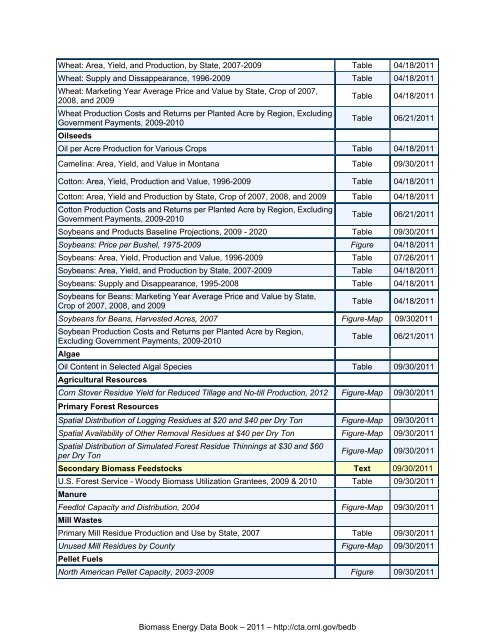
Wheat: Area, Yield, and Production, by State, 2007-2009 Table 04/18/2011<br />
Wheat: Supply and Dissappearance, 1996-2009 Table 04/18/2011<br />
Wheat: Marketing Year Average Price and Value by State, Crop of 2007,<br />
2008, and 2009<br />
Wheat Production Costs and Returns per Planted Acre by Region, Excluding<br />
Government Payments, 2009-2010<br />
Oilseeds<br />
Table 04/18/2011<br />
Table 06/21/2011<br />
Oil per Acre Production <strong>for</strong> Various Crops Table 04/18/2011<br />
Camelina: Area, Yield, and Value in Montana Table 09/30/2011<br />
Cotton: Area, Yield, Production and Value, 1996-2009 Table 04/18/2011<br />
Cotton: Area, Yield and Production by State, Crop of 2007, 2008, and 2009 Table 04/18/2011<br />
Cotton Production Costs and Returns per Planted Acre by Region, Excluding<br />
Government Payments, 2009-2010<br />
Table 06/21/2011<br />
Soybeans and Products Baseline Projections, 2009 - 2020 Table 09/30/2011<br />
Soybeans: Price per Bushel, 1975-2009 Figure 04/18/2011<br />
Soybeans: Area, Yield, Production and Value, 1996-2009 Table 07/26/2011<br />
Soybeans: Area, Yield, and Production by State, 2007-2009 Table 04/18/2011<br />
Soybeans: Supply and Disappearance, 1995-2008 Table 04/18/2011<br />
Soybeans <strong>for</strong> Beans: Marketing Year Average Price and Value by State,<br />
Crop of 2007, 2008, and 2009<br />
Table 04/18/2011<br />
Soybeans <strong>for</strong> Beans, Harvested Acres, 2007 Figure-Map 09/302011<br />
Soybean Production Costs and Returns per Planted Acre by Region,<br />
Excluding Government Payments, 2009-2010<br />
Algae<br />
Table 06/21/2011<br />
Oil Content in Selected Algal Species Table 09/30/2011<br />
Agricultural Resources<br />
Corn Stover Residue Yield <strong>for</strong> Reduced Tillage and No-till Production, 2012 Figure-Map 09/30/2011<br />
Primary Forest Resources<br />
Spatial Distribution of Logging Residues at $20 and $40 per Dry Ton Figure-Map 09/30/2011<br />
Spatial Availability of Other Removal Residues at $40 per Dry Ton Figure-Map 09/30/2011<br />
Spatial Distribution of Simulated Forest Residue Thinnings at $30 and $60<br />
per Dry Ton<br />
Figure-Map 09/30/2011<br />
Secondary <strong>Biomass</strong> Feedstocks Text 09/30/2011<br />
U.S. Forest Service - Woody <strong>Biomass</strong> Utilization Grantees, 2009 & 2010 Table 09/30/2011<br />
Manure<br />
Feedlot Capacity and Distribution, 2004 Figure-Map 09/30/2011<br />
Mill Wastes<br />
Primary Mill Residue Production and Use by State, 2007 Table 09/30/2011<br />
Unused Mill Residues by County Figure-Map 09/30/2011<br />
Pellet Fuels<br />
North American Pellet Capacity, 2003‐2009 Figure 09/30/2011<br />
<strong>Biomass</strong> <strong>Energy</strong> <strong>Data</strong> <strong>Book</strong> – 2011 – http://cta.ornl.gov/bedb


