Production of food <strong>for</strong> domestic livestock is the largest single use of corn grain, accounting <strong>for</strong> nearly half of all corn grain produced. Ethanol production is included in the food, seed and industrial category. Year (beginning September 1) Beginning stocks Supply Production Imports Total Feed and residual Food, seed, and industrial Total Exports Total disappear- ance Privately held a Govern - ment Total 1996 426 9,233 13 9,672 5,277 1,714 6,991 1,797 8,789 881 2 883 1997 883 9,207 9 10,099 5,482 1,805 7,287 1,504 8,791 1,304 4 1,308 1998 1,308 9,759 19 11,085 5,471 1,846 7,317 1,984 9,298 1,775 12 1,787 1999 1,787 9,431 15 11,232 5,664 1,913 7,578 1,937 9,515 1,704 14 1,718 2000 1,718 9,915 7 11,639 5,842 1,957 7,799 1,941 9,740 1,891 8 1,899 2001 1,899 9,503 10 11,412 5,864 2,046 7,911 1,905 9,815 1,590 6 1,596 2002 1,596 8,967 14 10,578 5,563 2,340 7,903 1,588 9,491 1,083 4 1,087 2003 1,087 10,089 14 11,190 5,795 2,537 8,332 1,900 10,232 958 0 958 2004 958 11,806 11 12,775 6,155 2,687 8,842 1,818 10,661 2,113 1 2,114 2005 2,114 11,112 9 13,235 6,152 2,982 9,134 2,134 11,268 1,967 0 1,967 2006 1,967 10,531 12 12,510 5,591 3,490 9,081 2,125 11,207 1,304 0 1,304 2007 1,304 13,038 20 14,362 5,858 4,442 10,300 2,437 12,737 1,624 0 1,624 2008 1,624 12,092 14 13,729 5,182 5,025 10,207 1,849 12,056 1,673 0 1,673 2009 b 1,673 13,110 8 14,791 5,525 5,900 11,425 1,980 13,405 1,386 0 1,386 2010 c 1,386 13,160 10 14,556 5,250 6,090 11,340 2,100 13,440 1,116 0 1,116 Source: U.S. Department of Agriculture, 2010 Agricultural Statistics , Table 1-38, http://www.nass.usda.gov/Publications/Ag_Statistics/index.asp Section: FEEDSTOCKS Corn: Supply and Disappearance, 1996-2010 (million bushels) Disappearance Domestic use a Includes quantity under loan and farmer-owned reserve. b Preliminary. c Projected as of January 11, 2010, World Agricultural Supply and Demand Estimates. Totals may not add due to rounding. <strong>Biomass</strong> <strong>Energy</strong> <strong>Data</strong> <strong>Book</strong> – 2011 – http://cta.ornl.gov/bedb Ending stocks August 31
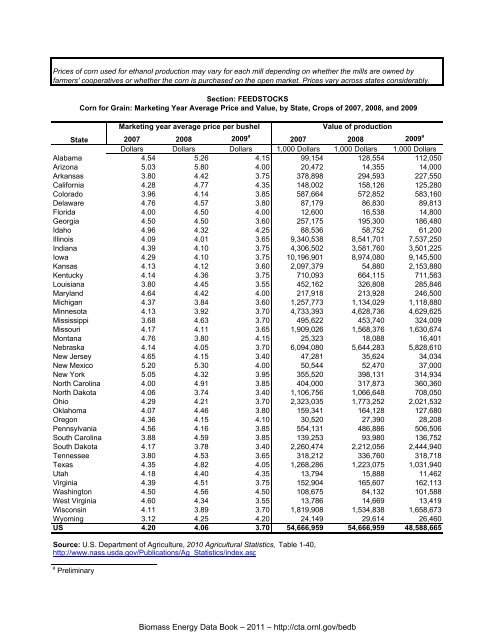
Prices of corn used <strong>for</strong> ethanol production may vary <strong>for</strong> each mill depending on whether the mills are owned by farmers' cooperatives or whether the corn is purchased on the open market. Prices vary across states considerably. 2007 2008 2009 a 2007 2008 2009 a State Dollars Dollars Dollars 1,000 Dollars 1,000 Dollars 1,000 Dollars Alabama 4.54 5.26 4.15 99,154 128,554 112,050 Arizona 5.03 5.80 4.00 20,472 14,355 14,000 Arkansas 3.80 4.42 3.75 378,898 294,593 227,550 Cali<strong>for</strong>nia 4.28 4.77 4.35 148,002 158,126 125,280 Colorado 3.96 4.14 3.85 587,664 572,852 583,160 Delaware 4.76 4.57 3.80 87,179 86,830 89,813 Florida 4.00 4.50 4.00 12,600 16,538 14,800 Georgia 4.50 4.50 3.60 257,175 195,300 186,480 Idaho 4.96 4.32 4.25 88,536 58,752 61,200 Illinois 4.09 4.01 3.65 9,340,538 8,541,701 7,537,250 Indiana 4.39 4.10 3.75 4,306,502 3,581,760 3,501,225 Iowa 4.29 4.10 3.75 10,196,901 8,974,080 9,145,500 Kansas 4.13 4.12 3.60 2,097,379 54,880 2,153,880 Kentucky 4.14 4.36 3.75 710,093 664,115 711,563 Louisiana 3.80 4.45 3.55 452,162 326,808 285,846 Maryland 4.64 4.42 4.00 217,918 213,928 246,500 Michigan 4.37 3.84 3.60 1,257,773 1,134,029 1,118,880 Minnesota 4.13 3.92 3.70 4,733,393 4,628,736 4,629,625 Mississippi 3.68 4.63 3.70 495,622 453,740 324,009 Missouri 4.17 4.11 3.65 1,909,026 1,568,376 1,630,674 Montana 4.76 3.80 4.15 25,323 18,088 16,401 Nebraska 4.14 4.05 3.70 6,094,080 5,644,283 5,828,610 New Jersey 4.65 4.15 3.40 47,281 35,624 34,034 New Mexico 5.20 5.30 4.00 50,544 52,470 37,000 New York 5.05 4.32 3.95 355,520 398,131 314,934 North Carolina 4.00 4.91 3.85 404,000 317,873 360,360 North Dakota 4.06 3.74 3.40 1,106,756 1,066,648 708,050 Ohio 4.29 4.21 3.70 2,323,035 1,773,252 2,021,532 Oklahoma 4.07 4.46 3.80 159,341 164,128 127,680 Oregon 4.36 4.15 4.10 30,520 27,390 28,208 Pennsylvania 4.56 4.16 3.85 554,131 486,886 506,506 South Carolina 3.88 4.59 3.85 139,253 93,980 136,752 South Dakota 4.17 3.78 3.40 2,260,474 2,212,056 2,444,940 Tennessee 3.80 4.53 3.65 318,212 336,760 318,718 Texas 4.35 4.82 4.05 1,268,286 1,223,075 1,031,940 Utah 4.18 4.40 4.35 13,794 15,888 11,462 Virginia 4.39 4.51 3.75 152,904 165,607 162,113 Washington 4.50 4.56 4.50 108,675 84,132 101,588 West Virginia 4.60 4.34 3.55 13,786 14,669 13,419 Wisconsin 4.11 3.89 3.70 1,819,908 1,534,838 1,658,673 Wyoming 3.12 4.25 4.20 24,149 29,614 26,460 US 4.20 4.06 3.70 54,666,959 54,666,959 48,588,665 Source: U.S. Department of Agriculture, 2010 Agricultural Statistics, Table 1-40, http://www.nass.usda.gov/Publications/Ag_Statistics/index.asp a Preliminary Section: FEEDSTOCKS Corn <strong>for</strong> Grain: Marketing Year Average Price and Value, by State, Crops of 2007, 2008, and 2009 Marketing year average price per bushel Value of production <strong>Biomass</strong> <strong>Energy</strong> <strong>Data</strong> <strong>Book</strong> – 2011 – http://cta.ornl.gov/bedb
- Page 2 and 3:
USEFUL WEB SITES GOVERNMENT LINKS U
- Page 4 and 5:
Users of the Biomass Energy Data B
- Page 6 and 7:
PREFACE The Department of Energy, t
- Page 8 and 9:
INTRODUCTION TO BIOMASS Contents Da
- Page 10 and 11:
Legislation passed in December 2007
- Page 12 and 13:
Natural Gas Plant Nuclear Electric
- Page 14 and 15:
Biofuels, which are produced mainly
- Page 16 and 17:
In 2010, biomass accounted for abou
- Page 18 and 19:
Biomass is the single largest sourc
- Page 20 and 21:
Life-cycle analyses (LCAs) are anot
- Page 22 and 23:
Indirect Land-Use Change - The Issu
- Page 24 and 25:
Greenhouse gas emissions are one of
- Page 26 and 27:
potential energy crop supplies vary
- Page 28 and 29:
In 2007, the United States had a to
- Page 30 and 31:
Section: INTRODUCTION Geographic Lo
- Page 32 and 33:
Section: INTRODUCTION Geographic Lo
- Page 34 and 35:
Currently used biomass feedstocks a
- Page 36 and 37:
BIOFUELS Contents Data Type Updated
- Page 38 and 39:
Biofuels Overview A variety of fuel
- Page 40 and 41:
Section: BIOFUELS Diagram of Routes
- Page 42 and 43:
Ethanol Overview There are two type
- Page 44 and 45:
Property Ethanol Gasoline No. 2 Die
- Page 46 and 47:
Fuel ethanol production has been on
- Page 48 and 49:
Although ethanol can be made from a
- Page 50 and 51:
With increased blending of ethanol
- Page 52 and 53:
The mash is processed in a high-tem
- Page 54 and 55:
4. Cellulose Hydrolysis. In this st
- Page 56 and 57:
Ethanol is used as an oxygenate, bl
- Page 58 and 59:
The net energy balance and greenhou
- Page 60 and 61:
This figure shows the fossil energy
- Page 62 and 63:
The GREET model was developed by Ar
- Page 64 and 65:
Biodiesel Overview Biodiesel is a c
- Page 66 and 67:
SECTION: BIOFUELS Biodiesel Product
- Page 68 and 69:
SECTION: BIOFUELS Biodiesel Product
- Page 70 and 71:
Section: BIOFUELS Typical Proportio
- Page 72 and 73:
Property Test Method B6 to B20 S15
- Page 74 and 75:
The results of a study conducted by
- Page 76 and 77:
Pyrolysis is thermal decomposition
- Page 78 and 79:
Bio-oil is a liquid fuel made from
- Page 80 and 81:
Section: BIOFUELS Annotated Summary
- Page 82 and 83:
BIOPOWER Contents Data Type Updated
- Page 84 and 85:
Technology Category Biomass Convers
- Page 86 and 87:
Reburning with Wood Fuels for NOx M
- Page 88 and 89:
Fuel And EIA Fuel Code Emissions Un
- Page 90 and 91:
For the purpose of agricultural soi
- Page 92 and 93:
There are three distinct markets fo
- Page 94 and 95:
There are a growing number of utili
- Page 96 and 97:
Utility Green Pricing Programs Usin
- Page 98 and 99:
Utility Green Pricing Programs Usin
- Page 100 and 101: Competitive Electricity Markets Ret
- Page 102 and 103: Number of New Biomass Plants Megawa
- Page 104 and 105: Current Biomass Power Plants (Conti
- Page 106 and 107: New Plants Megawatts 100 90 80 70 6
- Page 108 and 109: Current Landfill Gas Power Plants (
- Page 110 and 111: Current Landfill Gas Power Plants (
- Page 112 and 113: Current Landfill Gas Power Plants (
- Page 114 and 115: Current Landfill Gas Power Plants (
- Page 116 and 117: New Plants Megawatts 35 30 25 20 15
- Page 118 and 119: Current Municipal Solid Waste Power
- Page 120 and 121: Green Pricing Programs, which allow
- Page 122 and 123: Section: BIOPOWER Coal Displacement
- Page 124 and 125: Section: BIOPOWER Number of Home El
- Page 126 and 127: Biorefineries Overview As a petrole
- Page 128 and 129: Below are nineteen projects relevan
- Page 130 and 131: Section: BIOREFINERIES Integrated B
- Page 132 and 133: SECTION: BIOREFINERIES Integrated B
- Page 134 and 135: FEEDSTOCKS Contents Data Type Updat
- Page 136 and 137: Pellet and Cordwood Appliance Shipm
- Page 138 and 139: Year Planted a Harvested 1,000 Acre
- Page 140 and 141: Item Gross value of production 2009
- Page 142 and 143: The figure below shows that corn us
- Page 144 and 145: Overall, the price for corn has bee
- Page 146 and 147: Production of sufficient quantities
- Page 148 and 149: Due largely to increased ethanol de
- Page 152 and 153: These data show that government sub
- Page 154 and 155: 2007 2008 2009 2007 2008 2009 2007
- Page 156 and 157: Year Area Planted Harvested Section
- Page 158 and 159: Item Gross value of production 2009
- Page 160 and 161: The price for sorghum declined from
- Page 162 and 163: Sorghum is used for ethanol product
- Page 164 and 165: Item 2009/10 2010/11 2011/12 2012/1
- Page 166 and 167: Planted a Year harvested Marketing
- Page 168 and 169: Supply Section: FEEDSTOCKS Wheat: S
- Page 170 and 171: Item Gross value of production 2009
- Page 172 and 173: Camelina can be grown under margina
- Page 174 and 175: 2007 2008 2009 b 2007 2008 2009 b 2
- Page 176 and 177: USDA's 2008 soybean baseline projec
- Page 178 and 179: Year Area Planted Section: FEEDSTOC
- Page 180 and 181: In 2006, soybean stocks and product
- Page 182 and 183: Soybean production area is similar
- Page 184 and 185: Using algae as a feedstock for biof
- Page 186 and 187: Logging residues are the unused por
- Page 188 and 189: Forest residue thinnings are the ma
- Page 190 and 191: The Forest Service's State and Priv
- Page 192 and 193: The map below showing feedlot capac
- Page 194 and 195: Although the mill residues shown in
- Page 196 and 197: Shipments of cordwood appliances ha
- Page 198 and 199: Construction and demolition produce
- Page 200 and 201:
Appendix A - Conversions Contents D
- Page 202 and 203:
Section: Appendix A Heat Content Ra
- Page 204 and 205:
The Effect of Moisture on Heating V
- Page 206 and 207:
Measured Moisture, Elements, and Hi
- Page 208 and 209:
List and Definition of Symbols Symb
- Page 210 and 211:
Section: Appendix A Estimation of B
- Page 212 and 213:
Section: Appendix A Stand Level Bio
- Page 214 and 215:
The conversions in this table are o
- Page 216 and 217:
Section: Appendix A Estimating Tons
- Page 218 and 219:
Mass Section: Appendix A Mass Units
- Page 220 and 221:
Capacity and Volume 1 U.S. gallon (
- Page 222 and 223:
FROM: MJ J k W h Btu IT cal IT mega
- Page 224 and 225:
Section: Appendix A Alternative Mea
- Page 226 and 227:
Section: Appendix A SI Prefixes and
- Page 228 and 229:
Section: Appendix A Cost per Unit C
- Page 230 and 231:
Bioenergy Feedstocks Liquid Biofuel
- Page 232 and 233:
Bioenergy Feedstocks Liquid Biofuel
- Page 234 and 235:
Avoided costs - An investment guide
- Page 236 and 237:
Bulk density - Weight per unit of v
- Page 238 and 239:
harvested and cropland left idle al
- Page 240 and 241:
Feller-buncher - A self-propelled m
- Page 242 and 243:
Gasifier - A device for converting
- Page 244 and 245:
Horsepower - (electrical horsepower
- Page 246 and 247:
Moisture content - (MC) The weight
- Page 248 and 249:
Photosynthesis - Process by which c
- Page 250 and 251:
Reserve margin - The amount by whic
- Page 252 and 253:
Sustainable - An ecosystem conditio
- Page 254:
Waste streams - Unused solid or liq