In 2006, soybean stocks and production reached its greatest level during the period 1995-2008. Stocks by Position Farm Total 1995 105,130 229,684 334,814 2,174,254 2,513,524 1996 59,523 123,935 183,458 2,380,274 2,572,636 1997 43,600 88,233 131,833 2,688,750 2,825,589 1998 84,300 115,499 199,799 2,741,014 2,944,334 1999 145,000 203,482 348,482 2,653,758 3,006,411 2000 112,500 177,662 290,162 2,757,810 3,051,540 2001 83,500 164,247 247,747 2,890,682 3,140,749 2002 62,700 145,361 208,061 2,756,147 2,968,869 2003 58,000 120,329 178,329 2,453,665 2,637,773 2004 29,400 83,014 112,414 3,123,686 3,241,782 2005 99,700 156,038 255,738 3,063,237 3,327,452 2006 176,300 273,026 449,326 3,188,247 3,655,086 2007 143,000 430,810 573,810 2,677,117 3,260,798 2008 b Terminal market, interior mill, elevator, and warehouse Production Total 47,000 158,034 205,034 2,967,007 3,185,314 a Year beginning September Table continued Seed, feed and residual Exports Total 1995 1,369,541 111,441 849,084 2,330,066 1996 1,436,961 118,954 885,888 2,440,803 1997 1,596,980 154,476 874,334 2,625,790 1998 1,589,787 201,414 804,651 2,595,852 1999 1,577,650 165,194 973,405 2,716,249 2000 1,639,670 168,252 995,871 2,803,793 2001 1,699,741 169,296 1,063,651 2,932,688 2002 1,614,787 131,380 1,044,372 2,790,540 2003 1,529,699 109,072 886,551 2,525,322 2004 1,696,081 192,806 1,097,156 2,986,044 2005 1,738,852 199,396 939,879 2,878,126 2006 1,807,706 157,074 1,116,496 3,081,276 2007 1,803,407 93,445 1,158,829 3,055,764 2008 b Crushed 1,661,987 101,849 1,283,269 3,047,106 c Year beginning September Source: U.S. Department of Agriculture, 2010 Agricultural Statistics , Table 3-34, and previous annual editions, http://www.nass.usda.gov/Publications/Ag_Statistics/index.asp a Includes imports. b Preliminary. c Reported by the U.S. Department of Commerce. Section: FEEDSTOCKS Soybeans: Supply and Disappearance, 1995-2008 (thousand bushels) Supply Disappearance <strong>Biomass</strong> <strong>Energy</strong> <strong>Data</strong> <strong>Book</strong> – 2011 – http://cta.ornl.gov/bedb
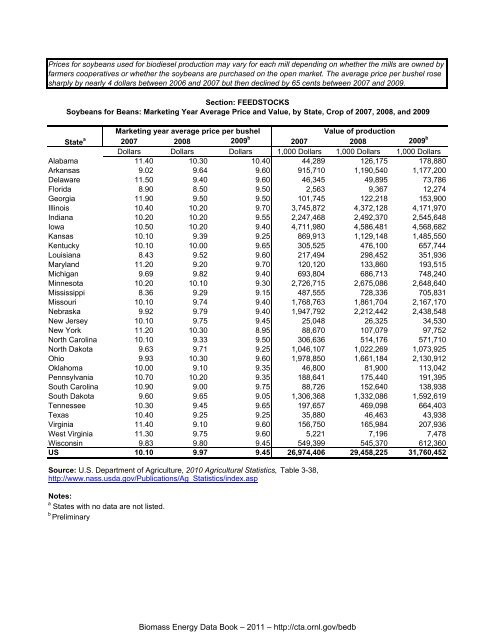
Prices <strong>for</strong> soybeans used <strong>for</strong> biodiesel production may vary <strong>for</strong> each mill depending on whether the mills are owned by farmers cooperatives or whether the soybeans are purchased on the open market. The average price per bushel rose sharply by nearly 4 dollars between 2006 and 2007 but then declined by 65 cents between 2007 and 2009. Section: FEEDSTOCKS Soybeans <strong>for</strong> Beans: Marketing Year Average Price and Value, by State, Crop of 2007, 2008, and 2009 2007 2008 2009 b 2007 2008 2009 b Marketing year average price per bushel State Dollars Dollars Dollars 1,000 Dollars 1,000 Dollars 1,000 Dollars Alabama 11.40 10.30 10.40 44,289 126,175 178,880 Arkansas 9.02 9.64 9.60 915,710 1,190,540 1,177,200 Delaware 11.50 9.40 9.60 46,345 49,895 73,786 Florida 8.90 8.50 9.50 2,563 9,367 12,274 Georgia 11.90 9.50 9.50 101,745 122,218 153,900 Illinois 10.40 10.20 9.70 3,745,872 4,372,128 4,171,970 Indiana 10.20 10.20 9.55 2,247,468 2,492,370 2,545,648 Iowa 10.50 10.20 9.40 4,711,980 4,586,481 4,568,682 Kansas 10.10 9.39 9.25 869,913 1,129,148 1,485,550 Kentucky 10.10 10.00 9.65 305,525 476,100 657,744 Louisiana 8.43 9.52 9.60 217,494 298,452 351,936 Maryland 11.20 9.20 9.70 120,120 133,860 193,515 Michigan 9.69 9.82 9.40 693,804 686,713 748,240 Minnesota 10.20 10.10 9.30 2,726,715 2,675,086 2,648,640 Mississippi 8.36 9.29 9.15 487,555 728,336 705,831 Missouri 10.10 9.74 9.40 1,768,763 1,861,704 2,167,170 Nebraska 9.92 9.79 9.40 1,947,792 2,212,442 2,438,548 New Jersey 10.10 9.75 9.45 25,048 26,325 34,530 New York 11.20 10.30 8.95 88,670 107,079 97,752 North Carolina 10.10 9.33 9.50 306,636 514,176 571,710 North Dakota 9.63 9.71 9.25 1,046,107 1,022,269 1,073,925 Ohio 9.93 10.30 9.60 1,978,850 1,661,184 2,130,912 Oklahoma 10.00 9.10 9.35 46,800 81,900 113,042 Pennsylvania 10.70 10.20 9.35 188,641 175,440 191,395 South Carolina 10.90 9.00 9.75 88,726 152,640 138,938 South Dakota 9.60 9.65 9.05 1,306,368 1,332,086 1,592,619 Tennessee 10.30 9.45 9.65 197,657 469,098 664,403 Texas 10.40 9.25 9.25 35,880 46,463 43,938 Virginia 11.40 9.10 9.60 156,750 165,984 207,936 West Virginia 11.30 9.75 9.60 5,221 7,196 7,478 Wisconsin 9.83 9.80 9.45 549,399 545,370 612,360 US 10.10 9.97 9.45 26,974,406 29,458,225 31,760,452 a Value of production Source: U.S. Department of Agriculture, 2010 Agricultural Statistics, Table 3-38, http://www.nass.usda.gov/Publications/Ag_Statistics/index.asp Notes: a States with no data are not listed. b Preliminary <strong>Biomass</strong> <strong>Energy</strong> <strong>Data</strong> <strong>Book</strong> – 2011 – http://cta.ornl.gov/bedb
- Page 2 and 3:
USEFUL WEB SITES GOVERNMENT LINKS U
- Page 4 and 5:
Users of the Biomass Energy Data B
- Page 6 and 7:
PREFACE The Department of Energy, t
- Page 8 and 9:
INTRODUCTION TO BIOMASS Contents Da
- Page 10 and 11:
Legislation passed in December 2007
- Page 12 and 13:
Natural Gas Plant Nuclear Electric
- Page 14 and 15:
Biofuels, which are produced mainly
- Page 16 and 17:
In 2010, biomass accounted for abou
- Page 18 and 19:
Biomass is the single largest sourc
- Page 20 and 21:
Life-cycle analyses (LCAs) are anot
- Page 22 and 23:
Indirect Land-Use Change - The Issu
- Page 24 and 25:
Greenhouse gas emissions are one of
- Page 26 and 27:
potential energy crop supplies vary
- Page 28 and 29:
In 2007, the United States had a to
- Page 30 and 31:
Section: INTRODUCTION Geographic Lo
- Page 32 and 33:
Section: INTRODUCTION Geographic Lo
- Page 34 and 35:
Currently used biomass feedstocks a
- Page 36 and 37:
BIOFUELS Contents Data Type Updated
- Page 38 and 39:
Biofuels Overview A variety of fuel
- Page 40 and 41:
Section: BIOFUELS Diagram of Routes
- Page 42 and 43:
Ethanol Overview There are two type
- Page 44 and 45:
Property Ethanol Gasoline No. 2 Die
- Page 46 and 47:
Fuel ethanol production has been on
- Page 48 and 49:
Although ethanol can be made from a
- Page 50 and 51:
With increased blending of ethanol
- Page 52 and 53:
The mash is processed in a high-tem
- Page 54 and 55:
4. Cellulose Hydrolysis. In this st
- Page 56 and 57:
Ethanol is used as an oxygenate, bl
- Page 58 and 59:
The net energy balance and greenhou
- Page 60 and 61:
This figure shows the fossil energy
- Page 62 and 63:
The GREET model was developed by Ar
- Page 64 and 65:
Biodiesel Overview Biodiesel is a c
- Page 66 and 67:
SECTION: BIOFUELS Biodiesel Product
- Page 68 and 69:
SECTION: BIOFUELS Biodiesel Product
- Page 70 and 71:
Section: BIOFUELS Typical Proportio
- Page 72 and 73:
Property Test Method B6 to B20 S15
- Page 74 and 75:
The results of a study conducted by
- Page 76 and 77:
Pyrolysis is thermal decomposition
- Page 78 and 79:
Bio-oil is a liquid fuel made from
- Page 80 and 81:
Section: BIOFUELS Annotated Summary
- Page 82 and 83:
BIOPOWER Contents Data Type Updated
- Page 84 and 85:
Technology Category Biomass Convers
- Page 86 and 87:
Reburning with Wood Fuels for NOx M
- Page 88 and 89:
Fuel And EIA Fuel Code Emissions Un
- Page 90 and 91:
For the purpose of agricultural soi
- Page 92 and 93:
There are three distinct markets fo
- Page 94 and 95:
There are a growing number of utili
- Page 96 and 97:
Utility Green Pricing Programs Usin
- Page 98 and 99:
Utility Green Pricing Programs Usin
- Page 100 and 101:
Competitive Electricity Markets Ret
- Page 102 and 103:
Number of New Biomass Plants Megawa
- Page 104 and 105:
Current Biomass Power Plants (Conti
- Page 106 and 107:
New Plants Megawatts 100 90 80 70 6
- Page 108 and 109:
Current Landfill Gas Power Plants (
- Page 110 and 111:
Current Landfill Gas Power Plants (
- Page 112 and 113:
Current Landfill Gas Power Plants (
- Page 114 and 115:
Current Landfill Gas Power Plants (
- Page 116 and 117:
New Plants Megawatts 35 30 25 20 15
- Page 118 and 119:
Current Municipal Solid Waste Power
- Page 120 and 121:
Green Pricing Programs, which allow
- Page 122 and 123:
Section: BIOPOWER Coal Displacement
- Page 124 and 125:
Section: BIOPOWER Number of Home El
- Page 126 and 127:
Biorefineries Overview As a petrole
- Page 128 and 129:
Below are nineteen projects relevan
- Page 130 and 131: Section: BIOREFINERIES Integrated B
- Page 132 and 133: SECTION: BIOREFINERIES Integrated B
- Page 134 and 135: FEEDSTOCKS Contents Data Type Updat
- Page 136 and 137: Pellet and Cordwood Appliance Shipm
- Page 138 and 139: Year Planted a Harvested 1,000 Acre
- Page 140 and 141: Item Gross value of production 2009
- Page 142 and 143: The figure below shows that corn us
- Page 144 and 145: Overall, the price for corn has bee
- Page 146 and 147: Production of sufficient quantities
- Page 148 and 149: Due largely to increased ethanol de
- Page 150 and 151: Production of food for domestic liv
- Page 152 and 153: These data show that government sub
- Page 154 and 155: 2007 2008 2009 2007 2008 2009 2007
- Page 156 and 157: Year Area Planted Harvested Section
- Page 158 and 159: Item Gross value of production 2009
- Page 160 and 161: The price for sorghum declined from
- Page 162 and 163: Sorghum is used for ethanol product
- Page 164 and 165: Item 2009/10 2010/11 2011/12 2012/1
- Page 166 and 167: Planted a Year harvested Marketing
- Page 168 and 169: Supply Section: FEEDSTOCKS Wheat: S
- Page 170 and 171: Item Gross value of production 2009
- Page 172 and 173: Camelina can be grown under margina
- Page 174 and 175: 2007 2008 2009 b 2007 2008 2009 b 2
- Page 176 and 177: USDA's 2008 soybean baseline projec
- Page 178 and 179: Year Area Planted Section: FEEDSTOC
- Page 182 and 183: Soybean production area is similar
- Page 184 and 185: Using algae as a feedstock for biof
- Page 186 and 187: Logging residues are the unused por
- Page 188 and 189: Forest residue thinnings are the ma
- Page 190 and 191: The Forest Service's State and Priv
- Page 192 and 193: The map below showing feedlot capac
- Page 194 and 195: Although the mill residues shown in
- Page 196 and 197: Shipments of cordwood appliances ha
- Page 198 and 199: Construction and demolition produce
- Page 200 and 201: Appendix A - Conversions Contents D
- Page 202 and 203: Section: Appendix A Heat Content Ra
- Page 204 and 205: The Effect of Moisture on Heating V
- Page 206 and 207: Measured Moisture, Elements, and Hi
- Page 208 and 209: List and Definition of Symbols Symb
- Page 210 and 211: Section: Appendix A Estimation of B
- Page 212 and 213: Section: Appendix A Stand Level Bio
- Page 214 and 215: The conversions in this table are o
- Page 216 and 217: Section: Appendix A Estimating Tons
- Page 218 and 219: Mass Section: Appendix A Mass Units
- Page 220 and 221: Capacity and Volume 1 U.S. gallon (
- Page 222 and 223: FROM: MJ J k W h Btu IT cal IT mega
- Page 224 and 225: Section: Appendix A Alternative Mea
- Page 226 and 227: Section: Appendix A SI Prefixes and
- Page 228 and 229: Section: Appendix A Cost per Unit C
- Page 230 and 231:
Bioenergy Feedstocks Liquid Biofuel
- Page 232 and 233:
Bioenergy Feedstocks Liquid Biofuel
- Page 234 and 235:
Avoided costs - An investment guide
- Page 236 and 237:
Bulk density - Weight per unit of v
- Page 238 and 239:
harvested and cropland left idle al
- Page 240 and 241:
Feller-buncher - A self-propelled m
- Page 242 and 243:
Gasifier - A device for converting
- Page 244 and 245:
Horsepower - (electrical horsepower
- Page 246 and 247:
Moisture content - (MC) The weight
- Page 248 and 249:
Photosynthesis - Process by which c
- Page 250 and 251:
Reserve margin - The amount by whic
- Page 252 and 253:
Sustainable - An ecosystem conditio
- Page 254:
Waste streams - Unused solid or liq