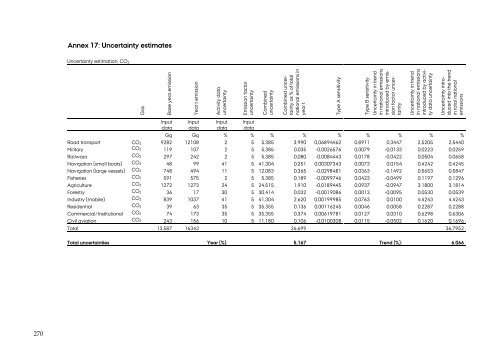
270 Annex 17: Uncertainty estimates Uncertainty estimation, CO2 Gas Base year emission Input data Year t emission Input data Activity data uncertainty Input data Emission factor uncertainty Input data Combined uncertainty Combined uncertainty as % of total national emissions in year t Type A sensitivity Type B sensitivity Uncertainty in trend in national emissions introduced by emission factor uncertainty Uncertainty in trend in national emissions introduced by activity data uncertainty Uncertainty introduced into the trend in total national emissions Gg Gg % % % % % % % % % Road transport CO2 9282 12108 2 5 5,385 3,990 0,06894462 0,8911 0,3447 2,5205 2,5440 Military CO2 119 107 2 5 5,385 0,035 -0,0026576 0,0079 -0,0133 0,0223 0,0259 Railways CO2 297 242 2 5 5,385 0,080 -0,0084443 0,0178 -0,0422 0,0504 0,0658 Navigation (small boats) CO2 48 99 41 5 41,304 0,251 0,00307343 0,0073 0,0154 0,4242 0,4245 Navigation (large vessels) CO2 748 494 11 5 12,083 0,365 -0,0298481 0,0363 -0,1492 0,5653 0,5847 Fisheries CO2 591 575 2 5 5,385 0,189 -0,0099746 0,0423 -0,0499 0,1197 0,1296 Agriculture CO2 1272 1273 24 5 24,515 1,910 -0,0189445 0,0937 -0,0947 3,1800 3,1814 Forestry CO2 36 17 30 5 30,414 0,032 -0,0019086 0,0013 -0,0095 0,0530 0,0539 Industry (mobile) CO2 839 1037 41 5 41,304 2,620 0,00199985 0,0763 0,0100 4,4243 4,4243 Residential CO2 39 63 35 5 35,355 0,136 0,00116245 0,0046 0,0058 0,2287 0,2288 Commercial/Institutional CO2 74 173 35 5 35,355 0,374 0,00619781 0,0127 0,0310 0,6298 0,6306 Civil aviation CO2 243 156 10 5 11,180 0,106 -0,0100308 0,0115 -0,0502 0,1620 0,1696 Total 13.587 16343 26,699 36,7952 Total uncertainties Year (%): 5,167 Trend (%): 6,066
Uncertainty estimation, CH4 Gas Base year emission Input data Year t emission Input data Activity data uncertainty Input data Emission factor uncertainty Input data Combined uncertainty Combined uncertainty as % of total national emissions in year t Type A sensitivity Type B sensitivity Uncertainty in trend in national emissions introduced by emission factor uncertainty Uncertainty in trend in national emissions introduced by activity data uncertainty Uncertainty introduced into the trend in total national emissions Mg Mg % % % % % % % % % Road transport CH4 2518 644 2 40 40,050 24,121 -0,0939264 0,2203 -3,7571 0,6230 3,8084 Military CH4 5 4 2 100 100,020 0,328 0,00055275 0,0012 0,0553 0,0034 0,0554 Railways CH4 12 7 2 100 100,020 0,680 0,00094452 0,0025 0,0945 0,0070 0,0947 Navigation (small boats) CH4 17 24 41 100 108,079 2,454 0,00623542 0,0083 0,6235 0,4815 0,7878 Navigation (large vessels) CH4 16 11 11 100 100,603 1,046 0,00181933 0,0038 0,1819 0,0592 0,1913 Fisheries CH4 13 14 2 100 100,020 1,290 0,00308187 0,0047 0,3082 0,0133 0,3085 Agriculture CH4 105 96 24 100 102,840 9,237 0,0197364 0,0329 1,9736 1,1150 2,2668 Forestry CH4 21 3 30 100 104,403 0,293 -0,0016 0,0010 -0,1600 0,0436 0,1658 Industry (mobile) CH4 60 37 41 100 108,079 3,784 0,00533736 0,0128 0,5337 0,7425 0,9145 Residential CH4 51 65 35 100 105,948 6,464 0,01593453 0,0223 1,5935 1,1044 1,9388 Commercial/Institutional CH4 99 160 35 100 105,948 15,811 0,04220095 0,0546 4,2201 2,7016 5,0108 Civil aviation CH4 7 4 10 100 100,499 0,377 0,00046654 0,0014 0,0467 0,0194 0,0505 Total 2923 1069 732,838 25,0317 Total uncertainties Year (%): 27,071 Trend (%): 5,003 271
- Page 1 and 2:
DANISH EMISSION INVENTORIES FOR ROA
- Page 3 and 4:
AU DANISH EMISSION INVENTORIES FOR
- Page 5 and 6:
Contents Preface 5 Summary 6 Method
- Page 7 and 8:
Preface DCE - Danish Centre for Env
- Page 9 and 10:
ook. For previous years the backgro
- Page 11 and 12:
Table 0.3 Emissions from other mobi
- Page 13 and 14:
Sammenfatning Denne rapport dokumen
- Page 15 and 16:
Tabel 0.2 Emissioner fra vejtrafik
- Page 17 and 18:
Usikkerheder I 2010 er CO2-emission
- Page 19 and 20:
2 Total Danish emissions, internati
- Page 21 and 22:
The LRTAP Convention is a framework
- Page 23 and 24:
machinery (SNAP codes 0806 and 0807
- Page 25 and 26:
Table 4.1 Model vehicle classes and
- Page 27 and 28:
period. The increase is, however, m
- Page 29 and 30:
procedure until the test procedure
- Page 31 and 32:
Table 4.2 Overview of the existing
- Page 33 and 34:
statistics and 2) fuel specific CO2
- Page 35 and 36:
Table 4.3 Fuel-specific CO2 emissio
- Page 37 and 38:
The cold:hot ratios depend on the a
- Page 39 and 40:
DEA:NERI fuel ratio DEA:NERI fuel r
- Page 41 and 42:
g pr GJ g pr km g pr km g pr GJ 100
- Page 43 and 44:
g pr GJ g pr km g pr km g pr GJ 160
- Page 45 and 46:
g pr km g pr GJ g pr km g pr GJ CH
- Page 47 and 48:
5 Input data and calculation method
- Page 49 and 50:
No. of international LTO's No. of d
- Page 51 and 52:
No. No. 30000 25000 20000 15000 100
- Page 53 and 54:
No. No. [No] Construction machinery
- Page 55 and 56:
100% 90% 80% 70% 60% 50% 40% 30% 20
- Page 57 and 58:
No. X 10 3 Table 5.9 Continued No.
- Page 59 and 60:
Table 5.1 Domestic ferry routes com
- Page 61 and 62:
For the remaining part of the traff
- Page 63 and 64:
Table 5.3 Overview of the EU Emissi
- Page 65 and 66:
Table 5.6 Current certification lim
- Page 67 and 68:
Table 5.8 Current legislation in re
- Page 69 and 70:
Table 5.9 Fuel-specific emission fa
- Page 71 and 72:
If the great circle distance, y, is
- Page 73 and 74:
Where EEvap,fueling, = hydrocarbon
- Page 75 and 76:
numbers for some statistical years
- Page 77 and 78:
6 Fuel consumption and emissions Ta
- Page 79 and 80:
PJ PJ 90 80 70 60 50 40 30 20 10 0
- Page 81 and 82:
PJ PJ PJ 3 2,5 2 1,5 1 0,5 0 1985 1
- Page 83 and 84:
PJ 45 40 35 30 25 20 15 10 5 0 1985
- Page 85 and 86:
Tonnes 350 300 250 200 150 100 50 0
- Page 87 and 88:
Tonnes 60 50 40 30 20 10 0 1990 199
- Page 89 and 90:
Tonnes emission-efficient EURO II,
- Page 91 and 92:
Tonnes 3000 2500 2000 1500 1000 500
- Page 93 and 94:
Tonnes trend in diesel fuel consump
- Page 95 and 96:
Tonnes Tonnes 3000,0 2500,0 2000,0
- Page 97 and 98:
the highest emissions in 2010, foll
- Page 99 and 100:
Cadmium (Cd) Cadmium (Cd) Chromium
- Page 101 and 102:
Tonnes Tonnes 250000 200000 150000
- Page 103 and 104:
Dioxin Dioxin Flouranthene Passenge
- Page 105 and 106:
Tonnes [kTonnes (CRF format). In An
- Page 107 and 108:
Table 7.2 Tier 2 Uncertainty factor
- Page 109 and 110:
8 Future improvements Some improvem
- Page 111 and 112:
IPCC, 2000: Good Practice Guidance
- Page 113 and 114:
Wismann, T. 2001: Energiforbrug og
- Page 115 and 116:
Annex1: Fleet data 1985-2010 for ro
- Page 117 and 118:
Continued Heavy Duty Vehicles Diese
- Page 119 and 120:
Continued Buses Diesel Urban Buses
- Page 121 and 122:
Continued Passenger Cars Diesel >2,
- Page 123 and 124:
Continued Heavy Duty Vehicles Diese
- Page 125 and 126:
Continued Motorcycles 4-stroke >750
- Page 127 and 128:
Continued Passenger Cars Diesel >2,
- Page 129 and 130:
Continued Heavy Duty Vehicles Diese
- Page 131 and 132:
Motorcycles 4-stroke 250 - 750 cm³
- Page 133 and 134:
Continued Heavy Duty Vehicles Diese
- Page 135 and 136:
Continued Buses Diesel Urban Buses
- Page 137 and 138:
Annex 3: EU directive emission limi
- Page 139 and 140:
Annex 4: Basis emission factors (g
- Page 141 and 142:
Continued Heavy Duty Vehicles Diese
- Page 143 and 144:
Continued Buses Diesel Urban Buses
- Page 145 and 146:
Continued Passenger Cars Diesel 2,0
- Page 147 and 148:
Continued Heavy Duty Vehicles Diese
- Page 149 and 150:
Continued Motorcycles 4-stroke 250
- Page 151 and 152:
Continued Passenger Cars Diesel >2,
- Page 153 and 154:
Continued Heavy Duty Veh. Diesel RT
- Page 155 and 156:
Continued Motorcycles 4-stroke 250
- Page 157 and 158:
Continued Passenger Cars Diesel >2,
- Page 159 and 160:
Continued Light Duty Vehicles 1992
- Page 161 and 162:
Continued Mopeds 1986 1,095 1,095 8
- Page 163 and 164:
Continued Passenger Cars 2004 0,871
- Page 165 and 166:
Continued Buses 2000 0,867 0,647 0,
- Page 167 and 168:
Annex 8: Fuel consumption (GJ) and
- Page 169 and 170:
Continued Heavy Duty Vehicles 2002
- Page 171 and 172:
Continued Motorcycles 1996 0,6 1 93
- Page 173 and 174:
Annex 9: COPERT IV:DEA statistics f
- Page 175 and 176:
ASJ Shorts 360 300 L2T DA30 RJ 100
- Page 177 and 178:
LTO no. per representative aircraft
- Page 179 and 180:
Domestic Other airports Reims F406
- Page 181 and 182:
No. of flights per representative a
- Page 183 and 184:
LTO fuel consumption and emission f
- Page 185 and 186:
Other airports Dash8 400 78,842 3,4
- Page 187 and 188:
2010 Copenhagen International Beech
- Page 189 and 190:
2010 Other Airports International S
- Page 191 and 192:
Basis factors for 4-stroke gasoline
- Page 193 and 194:
Fuel consumption and emission facto
- Page 195 and 196:
Deterioration factors for gasoline
- Page 197 and 198:
Operational data for construction m
- Page 199 and 200:
Stock data for diesel tractors 1985
- Page 201 and 202:
37 Stage II 23 53 162 324 330 340 3
- Page 203 and 204:
Stock data for harvesters 1985-2010
- Page 205 and 206:
Continued 90
- Page 207 and 208:
Stock data for fork lifts 1985-2010
- Page 209 and 210:
Stock data for construction machine
- Page 211 and 212:
Continued Wheel loaders (0-5 tonnes
- Page 213 and 214:
Stock data for machine pools 1985-2
- Page 215 and 216:
Continued 0809 Trimmers (private) S
- Page 217 and 218:
Continued 0811 Lawn movers (profess
- Page 219 and 220:
Engine sizes (kW) for recreational
- Page 221 and 222: Ferry data: Service, name, engine y
- Page 223 and 224: Continued Sjællands Odde-Ebeltoft
- Page 225 and 226: Continued Kalundborg-Århus KONG FR
- Page 227 and 228: Ferry data: Load factor (% MCR). Fe
- Page 229 and 230: Sjællands Odde-Ebeltoft MIE MOLS 8
- Page 231 and 232: Continued Kalundborg-Århus KONG FR
- Page 233 and 234: Annex 13 Fuel consumption and emiss
- Page 235 and 236: Continued 1995 7.49 7.86 8.72 2.34
- Page 237 and 238: S-%, SO2 and PM emission factors (g
- Page 239 and 240: Annex 14: Fuel sales figures from D
- Page 241 and 242: - kerosene 7 2 9 5 12 26 9 5 4 3 4
- Page 243 and 244: - gasoline 396 400 403 404 404 393
- Page 245 and 246: Annex 15: Emission factors and tota
- Page 247 and 248: 2009 emission factors for CO2, CH4,
- Page 249 and 250: 1990 emissions for CO2, CH4, N2O, S
- Page 251 and 252: 2009 emissions for CO2, CH4, N2O, S
- Page 253 and 254: Annex 16: Fuel consumption and emis
- Page 255 and 256: Continued CH4 Civil Aviation (1A3a)
- Page 257 and 258: Continued PM10 Comm./Inst. (1A4a) [
- Page 259 and 260: Continued Mercury Navigation int. (
- Page 261 and 262: Continued Benzo(b) flouranthene Roa
- Page 263 and 264: Emissions 2000-2010 pol_name IPCC I
- Page 265 and 266: Continued N2O Railways (1A3c) [tonn
- Page 267 and 268: Continued Cadmium Ag./for./fish. (1
- Page 269 and 270: Continued Zinc Industry-Other (1A2f
- Page 271: Continued Benzo(g,h,i) perylene Nav
- Page 275 and 276: Uncertainty estimation, SO2. Gas Ba
- Page 277 and 278: Uncertainty estimation, NH3. Gas Ba
- Page 279 and 280: Uncertainty estimation, Chromium. G
- Page 281 and 282: Uncertainty estimation, Lead. Gas B
- Page 283 and 284: Uncertainty estimation, Flouranthen
- Page 285 and 286: Uncertainty estimation, Benzo(g,h,i