DANISH EMISSION INVENTORIES FOR ROAD TRANSPORT ...
DANISH EMISSION INVENTORIES FOR ROAD TRANSPORT ...
DANISH EMISSION INVENTORIES FOR ROAD TRANSPORT ...
You also want an ePaper? Increase the reach of your titles
YUMPU automatically turns print PDFs into web optimized ePapers that Google loves.
26<br />
Veh. No x 10 3<br />
Veh. No x 10 3<br />
2000<br />
1600<br />
1200<br />
800<br />
400<br />
450<br />
400<br />
350<br />
300<br />
250<br />
200<br />
150<br />
100<br />
50<br />
0<br />
0<br />
1990<br />
1990<br />
1992<br />
Gasoline passenger cars<br />
1994<br />
1996<br />
1998<br />
2000<br />
2002<br />
2004<br />
2006<br />
2008<br />
PRE ECE ECE 15/00-01 ECE 15/02<br />
ECE 15/03 ECE 15/04 Euro I<br />
Euro II Euro III Euro IV<br />
1992<br />
1994<br />
Light duty vehicles<br />
1996<br />
1998<br />
2000<br />
Conventional Euro I Euro II Euro III Euro IV Euro V<br />
2002<br />
2004<br />
2006<br />
2008<br />
2010<br />
2010<br />
Veh. No x 10 3<br />
Veh. No x 10 3<br />
600<br />
550<br />
500<br />
450<br />
400<br />
350<br />
300<br />
250<br />
200<br />
150<br />
100<br />
50<br />
0<br />
1990<br />
70<br />
60<br />
50<br />
40<br />
30<br />
20<br />
10<br />
0<br />
1990<br />
1992<br />
Diesel passenger cars<br />
1994<br />
1996<br />
1998<br />
2000<br />
Conventional Euro I Euro II Euro III Euro IV Euro V<br />
1992<br />
1994<br />
2002<br />
Trucks and buses<br />
1996<br />
1998<br />
2000<br />
2002<br />
2004<br />
2004<br />
2006<br />
2006<br />
2008<br />
2008<br />
Conventional Euro I Euro II Euro III Euro IV Euro V<br />
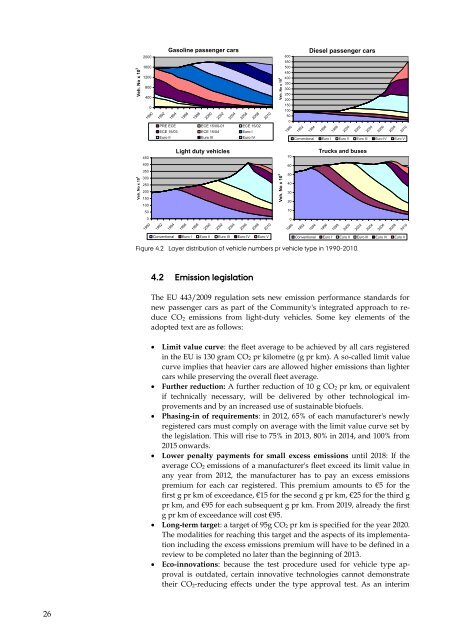
Figure 4.2 Layer distribution of vehicle numbers pr vehicle type in 1990-2010.<br />
4.2 Emission legislation<br />
The EU 443/2009 regulation sets new emission performance standards for<br />
new passenger cars as part of the Community's integrated approach to reduce<br />
CO2 emissions from light-duty vehicles. Some key elements of the<br />
adopted text are as follows:<br />
Limit value curve: the fleet average to be achieved by all cars registered<br />
in the EU is 130 gram CO2 pr kilometre (g pr km). A so-called limit value<br />
curve implies that heavier cars are allowed higher emissions than lighter<br />
cars while preserving the overall fleet average.<br />
Further reduction: A further reduction of 10 g CO2 pr km, or equivalent<br />
if technically necessary, will be delivered by other technological improvements<br />
and by an increased use of sustainable biofuels.<br />
Phasing-in of requirements: in 2012, 65% of each manufacturer's newly<br />
registered cars must comply on average with the limit value curve set by<br />
the legislation. This will rise to 75% in 2013, 80% in 2014, and 100% from<br />
2015 onwards.<br />
Lower penalty payments for small excess emissions until 2018: If the<br />
average CO2 emissions of a manufacturer's fleet exceed its limit value in<br />
any year from 2012, the manufacturer has to pay an excess emissions<br />
premium for each car registered. This premium amounts to €5 for the<br />
first g pr km of exceedance, €15 for the second g pr km, €25 for the third g<br />
pr km, and €95 for each subsequent g pr km. From 2019, already the first<br />
g pr km of exceedance will cost €95.<br />
Long-term target: a target of 95g CO2 pr km is specified for the year 2020.<br />
The modalities for reaching this target and the aspects of its implementation<br />
including the excess emissions premium will have to be defined in a<br />
review to be completed no later than the beginning of 2013.<br />
Eco-innovations: because the test procedure used for vehicle type approval<br />
is outdated, certain innovative technologies cannot demonstrate<br />
their CO2-reducing effects under the type approval test. As an interim<br />
2010<br />
2010


