- Page 1 and 2: DANISH EMISSION INVENTORIES FOR ROA
- Page 3 and 4: AU DANISH EMISSION INVENTORIES FOR
- Page 5 and 6: Contents Preface 5 Summary 6 Method
- Page 7 and 8: Preface DCE - Danish Centre for Env
- Page 9 and 10: ook. For previous years the backgro
- Page 11 and 12: Table 0.3 Emissions from other mobi
- Page 13 and 14: Sammenfatning Denne rapport dokumen
- Page 15 and 16: Tabel 0.2 Emissioner fra vejtrafik
- Page 17 and 18: Usikkerheder I 2010 er CO2-emission
- Page 19 and 20: 2 Total Danish emissions, internati
- Page 21 and 22: The LRTAP Convention is a framework
- Page 23 and 24: machinery (SNAP codes 0806 and 0807
- Page 25 and 26: Table 4.1 Model vehicle classes and
- Page 27 and 28: period. The increase is, however, m
- Page 29 and 30: procedure until the test procedure
- Page 31 and 32: Table 4.2 Overview of the existing
- Page 33 and 34: statistics and 2) fuel specific CO2
- Page 35 and 36: Table 4.3 Fuel-specific CO2 emissio
- Page 37 and 38: The cold:hot ratios depend on the a
- Page 39 and 40: DEA:NERI fuel ratio DEA:NERI fuel r
- Page 41 and 42: g pr GJ g pr km g pr km g pr GJ 100
- Page 43 and 44: g pr GJ g pr km g pr km g pr GJ 160
- Page 45 and 46: g pr km g pr GJ g pr km g pr GJ CH
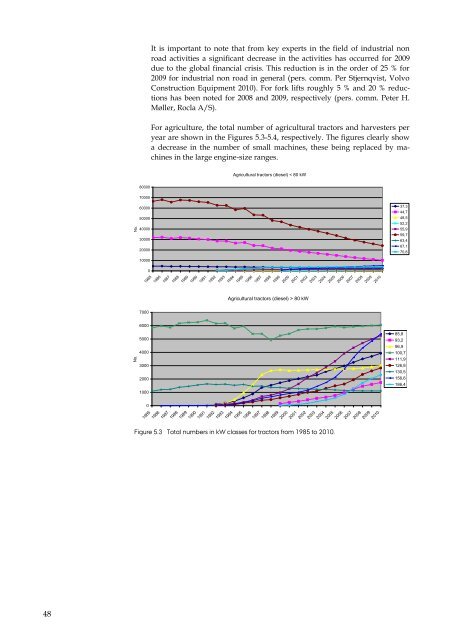
- Page 47 and 48: 5 Input data and calculation method
- Page 49: No. of international LTO's No. of d
- Page 53 and 54: No. No. [No] Construction machinery
- Page 55 and 56: 100% 90% 80% 70% 60% 50% 40% 30% 20
- Page 57 and 58: No. X 10 3 Table 5.9 Continued No.
- Page 59 and 60: Table 5.1 Domestic ferry routes com
- Page 61 and 62: For the remaining part of the traff
- Page 63 and 64: Table 5.3 Overview of the EU Emissi
- Page 65 and 66: Table 5.6 Current certification lim
- Page 67 and 68: Table 5.8 Current legislation in re
- Page 69 and 70: Table 5.9 Fuel-specific emission fa
- Page 71 and 72: If the great circle distance, y, is
- Page 73 and 74: Where EEvap,fueling, = hydrocarbon
- Page 75 and 76: numbers for some statistical years
- Page 77 and 78: 6 Fuel consumption and emissions Ta
- Page 79 and 80: PJ PJ 90 80 70 60 50 40 30 20 10 0
- Page 81 and 82: PJ PJ PJ 3 2,5 2 1,5 1 0,5 0 1985 1
- Page 83 and 84: PJ 45 40 35 30 25 20 15 10 5 0 1985
- Page 85 and 86: Tonnes 350 300 250 200 150 100 50 0
- Page 87 and 88: Tonnes 60 50 40 30 20 10 0 1990 199
- Page 89 and 90: Tonnes emission-efficient EURO II,
- Page 91 and 92: Tonnes 3000 2500 2000 1500 1000 500
- Page 93 and 94: Tonnes trend in diesel fuel consump
- Page 95 and 96: Tonnes Tonnes 3000,0 2500,0 2000,0
- Page 97 and 98: the highest emissions in 2010, foll
- Page 99 and 100: Cadmium (Cd) Cadmium (Cd) Chromium
- Page 101 and 102:
Tonnes Tonnes 250000 200000 150000
- Page 103 and 104:
Dioxin Dioxin Flouranthene Passenge
- Page 105 and 106:
Tonnes [kTonnes (CRF format). In An
- Page 107 and 108:
Table 7.2 Tier 2 Uncertainty factor
- Page 109 and 110:
8 Future improvements Some improvem
- Page 111 and 112:
IPCC, 2000: Good Practice Guidance
- Page 113 and 114:
Wismann, T. 2001: Energiforbrug og
- Page 115 and 116:
Annex1: Fleet data 1985-2010 for ro
- Page 117 and 118:
Continued Heavy Duty Vehicles Diese
- Page 119 and 120:
Continued Buses Diesel Urban Buses
- Page 121 and 122:
Continued Passenger Cars Diesel >2,
- Page 123 and 124:
Continued Heavy Duty Vehicles Diese
- Page 125 and 126:
Continued Motorcycles 4-stroke >750
- Page 127 and 128:
Continued Passenger Cars Diesel >2,
- Page 129 and 130:
Continued Heavy Duty Vehicles Diese
- Page 131 and 132:
Motorcycles 4-stroke 250 - 750 cm³
- Page 133 and 134:
Continued Heavy Duty Vehicles Diese
- Page 135 and 136:
Continued Buses Diesel Urban Buses
- Page 137 and 138:
Annex 3: EU directive emission limi
- Page 139 and 140:
Annex 4: Basis emission factors (g
- Page 141 and 142:
Continued Heavy Duty Vehicles Diese
- Page 143 and 144:
Continued Buses Diesel Urban Buses
- Page 145 and 146:
Continued Passenger Cars Diesel 2,0
- Page 147 and 148:
Continued Heavy Duty Vehicles Diese
- Page 149 and 150:
Continued Motorcycles 4-stroke 250
- Page 151 and 152:
Continued Passenger Cars Diesel >2,
- Page 153 and 154:
Continued Heavy Duty Veh. Diesel RT
- Page 155 and 156:
Continued Motorcycles 4-stroke 250
- Page 157 and 158:
Continued Passenger Cars Diesel >2,
- Page 159 and 160:
Continued Light Duty Vehicles 1992
- Page 161 and 162:
Continued Mopeds 1986 1,095 1,095 8
- Page 163 and 164:
Continued Passenger Cars 2004 0,871
- Page 165 and 166:
Continued Buses 2000 0,867 0,647 0,
- Page 167 and 168:
Annex 8: Fuel consumption (GJ) and
- Page 169 and 170:
Continued Heavy Duty Vehicles 2002
- Page 171 and 172:
Continued Motorcycles 1996 0,6 1 93
- Page 173 and 174:
Annex 9: COPERT IV:DEA statistics f
- Page 175 and 176:
ASJ Shorts 360 300 L2T DA30 RJ 100
- Page 177 and 178:
LTO no. per representative aircraft
- Page 179 and 180:
Domestic Other airports Reims F406
- Page 181 and 182:
No. of flights per representative a
- Page 183 and 184:
LTO fuel consumption and emission f
- Page 185 and 186:
Other airports Dash8 400 78,842 3,4
- Page 187 and 188:
2010 Copenhagen International Beech
- Page 189 and 190:
2010 Other Airports International S
- Page 191 and 192:
Basis factors for 4-stroke gasoline
- Page 193 and 194:
Fuel consumption and emission facto
- Page 195 and 196:
Deterioration factors for gasoline
- Page 197 and 198:
Operational data for construction m
- Page 199 and 200:
Stock data for diesel tractors 1985
- Page 201 and 202:
37 Stage II 23 53 162 324 330 340 3
- Page 203 and 204:
Stock data for harvesters 1985-2010
- Page 205 and 206:
Continued 90
- Page 207 and 208:
Stock data for fork lifts 1985-2010
- Page 209 and 210:
Stock data for construction machine
- Page 211 and 212:
Continued Wheel loaders (0-5 tonnes
- Page 213 and 214:
Stock data for machine pools 1985-2
- Page 215 and 216:
Continued 0809 Trimmers (private) S
- Page 217 and 218:
Continued 0811 Lawn movers (profess
- Page 219 and 220:
Engine sizes (kW) for recreational
- Page 221 and 222:
Ferry data: Service, name, engine y
- Page 223 and 224:
Continued Sjællands Odde-Ebeltoft
- Page 225 and 226:
Continued Kalundborg-Århus KONG FR
- Page 227 and 228:
Ferry data: Load factor (% MCR). Fe
- Page 229 and 230:
Sjællands Odde-Ebeltoft MIE MOLS 8
- Page 231 and 232:
Continued Kalundborg-Århus KONG FR
- Page 233 and 234:
Annex 13 Fuel consumption and emiss
- Page 235 and 236:
Continued 1995 7.49 7.86 8.72 2.34
- Page 237 and 238:
S-%, SO2 and PM emission factors (g
- Page 239 and 240:
Annex 14: Fuel sales figures from D
- Page 241 and 242:
- kerosene 7 2 9 5 12 26 9 5 4 3 4
- Page 243 and 244:
- gasoline 396 400 403 404 404 393
- Page 245 and 246:
Annex 15: Emission factors and tota
- Page 247 and 248:
2009 emission factors for CO2, CH4,
- Page 249 and 250:
1990 emissions for CO2, CH4, N2O, S
- Page 251 and 252:
2009 emissions for CO2, CH4, N2O, S
- Page 253 and 254:
Annex 16: Fuel consumption and emis
- Page 255 and 256:
Continued CH4 Civil Aviation (1A3a)
- Page 257 and 258:
Continued PM10 Comm./Inst. (1A4a) [
- Page 259 and 260:
Continued Mercury Navigation int. (
- Page 261 and 262:
Continued Benzo(b) flouranthene Roa
- Page 263 and 264:
Emissions 2000-2010 pol_name IPCC I
- Page 265 and 266:
Continued N2O Railways (1A3c) [tonn
- Page 267 and 268:
Continued Cadmium Ag./for./fish. (1
- Page 269 and 270:
Continued Zinc Industry-Other (1A2f
- Page 271 and 272:
Continued Benzo(g,h,i) perylene Nav
- Page 273 and 274:
Uncertainty estimation, CH4 Gas Bas
- Page 275 and 276:
Uncertainty estimation, SO2. Gas Ba
- Page 277 and 278:
Uncertainty estimation, NH3. Gas Ba
- Page 279 and 280:
Uncertainty estimation, Chromium. G
- Page 281 and 282:
Uncertainty estimation, Lead. Gas B
- Page 283 and 284:
Uncertainty estimation, Flouranthen
- Page 285 and 286:
Uncertainty estimation, Benzo(g,h,i