Rating Models and Validation - Oesterreichische Nationalbank
Rating Models and Validation - Oesterreichische Nationalbank
Rating Models and Validation - Oesterreichische Nationalbank

You also want an ePaper? Increase the reach of your titles
YUMPU automatically turns print PDFs into web optimized ePapers that Google loves.
<strong>Rating</strong> <strong>Models</strong> <strong>and</strong> <strong>Validation</strong><br />
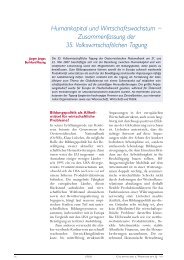
Chart 64: Table of Bayesian Error Rates for Selected Sample Default Rates in the Data Example<br />
As the table shows, one severe drawback of using the Bayesian error rate to<br />
calculate a rating modelÕs discriminatory power is its heavy dependence on the<br />
default rate in the sample examined. Therefore, direct comparisons of Bayesian<br />
error rate values derived from different samples are not possible. In contrast,<br />
the measures of discriminatory power mentioned thus far (AUC, the Gini Coefficient<br />
<strong>and</strong> the Pietra Index) are independent of the default probability in the<br />
sample examined.<br />
The Bayesian error rate is linked to an optimum cutoff value which minimizes<br />
the total number of misclassifications (a error plus b error) in the rating<br />
system. However, as the optimum always occurs when no cases are rejected<br />
(a ¼ 100%, b ¼ 0%), it becomes clear that the Bayesian error rate hardly allows<br />
the differentiated selection of an optimum cutoff value for the low default rates<br />
p occurring in the validation of rating models.<br />
Due to the various costs of a <strong>and</strong> b errors, the cutoff value determined by<br />
the Bayesian error rate is not optimal in business terms, that is, it does not minimize<br />
the overall costs arising from misclassification, which are usually substantially<br />
higher for a errors than for b errors.<br />
For the default rate p ¼ 50%, the Bayesian error rate equals exactly half the<br />
sum of a <strong>and</strong> b for the point on the a—b error curve which is closest to point<br />
(0, 0) with regard to the total a <strong>and</strong> b errors (cf. chart 65). In this case, the<br />
following is also true (a <strong>and</strong> b errors are denoted as a <strong>and</strong> b): 91<br />
ER ¼ min½ þ Š¼ max½1 1Š ¼ max½F bad<br />
cum<br />
¼ ð1 Pietra IndexÞ<br />
good F cum<br />
Šþ ¼<br />
However, this equivalence of the Bayesian error rate to the Pietra Index only<br />
applies where p ¼ 50%. 92<br />
91 The Bayesian error rate ER is defined at the beginning of the equation for the case where p ¼ 50%. The error values a <strong>and</strong> b<br />
are related to the frequency distributions of good <strong>and</strong> bad cases, which are applied in the second to last expression. The last<br />
expression follows from the representation of the Pietra Index as the maximum difference between these frequency distributions.<br />
92 Cf. LEE, Global Performances of Diagnostic Tests.<br />
112 Guidelines on Credit Risk Management