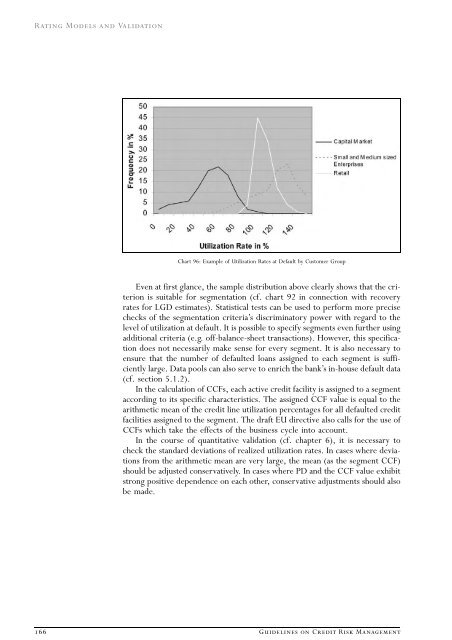
<strong>Rating</strong> <strong>Models</strong> <strong>and</strong> <strong>Validation</strong> Chart 96: Example of Utilization Rates at Default by Customer Group Even at first glance, the sample distribution above clearly shows that the criterion is suitable for segmentation (cf. chart 92 in connection with recovery rates for LGD estimates). Statistical tests can be used to perform more precise checks of the segmentation criteriaÕs discriminatory power with regard to the level of utilization at default. It is possible to specify segments even further using additional criteria (e.g. off-balance-sheet transactions). However, this specification does not necessarily make sense for every segment. It is also necessary to ensure that the number of defaulted loans assigned to each segment is sufficiently large. Data pools can also serve to enrich the bankÕs in-house default data (cf. section 5.1.2). In the calculation of CCFs, each active credit facility is assigned to a segment according to its specific characteristics. The assigned CCF value is equal to the arithmetic mean of the credit line utilization percentages for all defaulted credit facilities assigned to the segment. The draft EU directive also calls for the use of CCFs which take the effects of the business cycle into account. In the course of quantitative validation (cf. chapter 6), it is necessary to check the st<strong>and</strong>ard deviations of realized utilization rates. In cases where deviations from the arithmetic mean are very large, the mean (as the segment CCF) should be adjusted conservatively. In cases where PD <strong>and</strong> the CCF value exhibit strong positive dependence on each other, conservative adjustments should also be made. 166 Guidelines on Credit Risk Management
IV REFERENCES Backhaus, Klaus/Erichson, Bernd/Plinke, Wulff/Weiber, Rolf, Multivariate Analysemethoden: Eine anwendungsorientierte Einfu‹hrung, 9th ed., Berlin 1996 (Multivariate Analysemethoden) Baetge, Jo‹ rg, Bilanzanalyse, Du‹sseldorf 1998 (Bilanzanalyse) Baetge, Jo‹rg, Mo‹glichkeiten der Objektivierung des Jahreserfolges, Du‹sseldorf 1970 (Objektivierung des Jahreserfolgs) Baetge, Jo‹ rg/Heitmann, Christian, Kennzahlen, in: Lexikon der internen Revision, Lu‹ck, Wolfgang (ed.), Munich 2001, 170—172 (Kennzahlen) Basler Ausschuss fu‹ r Bankenaufsicht, Consultation Paper — The New Basel Capital Accord, 2003 (Consultation Paper 2003) Black, F./Scholes, M., The Pricing of Options <strong>and</strong> Corporate Liabilities, in: The Journal of Political Economy 1973, Vol. 81, 63—654 (Pricing of Options) Blochwitz, Stefan/Eigermann, Judith, Effiziente Kreditrisikobeurteilung durch Diskriminanzanalyse mit qualitativen Merkmale, in: H<strong>and</strong>buch Kreditrisikomodelle und Kreditderivate, Eller, R./Gruber, W./Reif, M. (eds.), Stuttgart 2000, 3-22 (Effiziente Kreditrisikobeurteilung durch Diskriminanzanalyse mit qualitativen Merkmalen) Blochwitz, Stefan/Eigermann, Judith, Unternehmensbeurteilung durch Diskriminanzanalyse mit qualitativen Merkmalen, in: Zfbf Feb/2000, 58—73 (Unternehmensbeurteilung durch Diskriminanzanalyse mit qualitativen Merkmalen) Blochwitz, Stefan/Eigermann, Judith, Das modulare Bonita‹tsbeurteilungsverfahren der Deutschen Bundesbank, in: Deutsche Bundesbank, Tagungsdokumentation — Neuere Verfahren zur kreditgescha‹ftlichen Bonita‹tsbeurteilung von Nichtbanken, Eltville 2000 (Bonita‹tsbeurteilungsverfahren der Deutschen Bundesbank) Brier, G. W., Monthly Weather Review, 75 (1952), 1—3 (Brier Score) Bruckner, Bernulf (2001), Modellierung von Expertensystemen zum <strong>Rating</strong>, in: <strong>Rating</strong> — Chance fu‹r den Mittelst<strong>and</strong> nach Basel II, Everling, Oliver (ed.), Wiesbaden 2001, 387—400 (Expertensysteme) Cantor, R./Falkenstein, E., Testing for rating consistencies in annual default rates, Journal of fixed income, September 2001, 36ff (Testing for rating consistencies in annual default rates) Deutsche Bundesbank, Monthly Report for Sept. 2003, Approaches to the validation of internal rating systems Deutsche Bundesbank, Tagungsb<strong>and</strong> zur Veranstaltung ªNeuere Verfahren zur kreditgescha‹ftlichen Bonita‹tsbeurteilung von NichtbankenÒ, Eltville 2000 (Neuere Verfahren zur kreditgescha‹ftlichen Bonita‹tsbeurteilung) Duffie, D./Singleton, K. J., Simulating correlated defaults, Stanford, preprint 1999 (Simulating correlated defaults) Duffie, D./Singleton, K. J., Credit Risk: Pricing, Measurement <strong>and</strong> Management, Princeton University Press, 2003 (Credit Risk) Eigermann, Judith, Quantitatives Credit-<strong>Rating</strong> mit qualitativen Merkmalen, in: <strong>Rating</strong> — Chance fu‹r den Mittelst<strong>and</strong> nach Basel II, Everling, Oliver (ed.), Wiesbaden 2001, 343—362 (Quantitatives Credit-<strong>Rating</strong> mit qualitativen Merkmalen) Eigermann, Judith, Quantitatives Credit-<strong>Rating</strong> unter Einbeziehung qualitativer Merkmale, Kaiserslautern 2001 (Quantitatives Credit-<strong>Rating</strong> unter Einbeziehung qualitativer Merkmale) European Commission, Review of Capital Requirements for Banks <strong>and</strong> Investment Firms — Commission Services Third Consultative Document — Working Paper, July 2003, (draft EU directive on regulatory capital requirements) Fahrmeir/Henking/Hu‹ ls, Vergleich von Scoreverfahren, risknews 11/2002, http://www.risknews.de (Vergleich von Scoreverfahren) <strong>Rating</strong> <strong>Models</strong> <strong>and</strong> <strong>Validation</strong> Guidelines on Credit Risk Management 167
- Page 1 and 2:
≈√ Guidelines on Credit Risk Ma
- Page 3 and 4:
The ongoing development of contempo
- Page 5 and 6:
5 Developing a Rating Model 60 5.1
- Page 7 and 8:
Rating Models and Validation I INTR
- Page 9 and 10:
This segmentation from the business
- Page 11 and 12:
The best-practice segmentation pres
- Page 13 and 14:
Chart 2: Data Requirements for Gove
- Page 15 and 16:
2.2 Financial Service Providers In
- Page 17 and 18:
Insurance Companies Due to their di
- Page 19 and 20:
Capital Market-Oriented/Internation
- Page 21 and 22:
— Market prospects are not assess
- Page 23 and 24:
Chart 5: Data Requirements for Corp
- Page 25 and 26:
elationships in the project, these
- Page 27 and 28:
Before the Project As the repayment
- Page 29 and 30:
Chart 6: Data Requirements for Reta
- Page 31 and 32:
During the Credit Term Instead of o
- Page 33 and 34:
3.1 Heuristic Models Heuristic mode
- Page 35 and 36:
Chart 9: Information Categories for
- Page 37 and 38:
Explanatory Component The explanato
- Page 39 and 40:
This example defines linguistic ter
- Page 41 and 42:
ments as to whether higher or lower
- Page 43 and 44:
Chart 16: Indicators in the ÒCrebo
- Page 45 and 46:
Logistic regression has a number of
- Page 47 and 48:
adapts the network according to any
- Page 49 and 50:
The parameters required to calculat
- Page 51 and 52:
ture of the borrowerÕs creditworth
- Page 53 and 54:
Chart 24: Vertical Linking of Ratin
- Page 55 and 56:
e necessary in this case if the def
- Page 57 and 58:
4.1.5 Consistency Heuristic models
- Page 59 and 60:
Compared to heuristic models, stati
- Page 61 and 62:
the data set and statistical testin
- Page 63 and 64:
data collection procedure. This pro
- Page 65 and 66:
full surveys is often too high, esp
- Page 67 and 68:
essential structural characteristic
- Page 69 and 70:
For each block, interim objectives
- Page 71 and 72:
Chart 34: Creating the Analysis Dat
- Page 73 and 74:
Chart 35: Creating the Analysis and
- Page 75 and 76:
Once a quality-assured data set has
- Page 77 and 78:
an indicator should only be used in
- Page 79 and 80:
Transformation of Indicators In ord
- Page 81 and 82:
the scoring functions developed usi
- Page 83 and 84:
Chart 37: Significance of Quantitat
- Page 85 and 86:
— For all other statistical and h
- Page 87 and 88:
of approximately 10 intervals shoul
- Page 89 and 90:
With regard to the time interval be
- Page 91 and 92:
around the main diagonal, however,
- Page 93 and 94:
tial increase in marginal default r
- Page 95 and 96:
Chart 46: Aspects of Rating Model V
- Page 97 and 98:
— Model development procedure Mod
- Page 99 and 100:
and bad refer to whether a credit d
- Page 101 and 102:
numbers of cases per class observed
- Page 103 and 104:
Chart 54: Depiction of a and b erro
- Page 105 and 106:
Chart 57: Shape of the a—b Error
- Page 107 and 108:
Interpretation of the Pietra Index
- Page 109 and 110:
The following relation applies to t
- Page 111 and 112:
Chart 62: ROC Curve with Simultaneo
- Page 113 and 114:
Chart 65: Interpretation of the Bay
- Page 115 and 116: The table below (chart 67) shows a
- Page 117 and 118: The lower the Brier Score is, the b
- Page 119 and 120: Chart 70 shows the reliability diag
- Page 121 and 122: Chart 71: Identification of Signifi
- Page 123 and 124: estimates, which means that it is e
- Page 125 and 126: transition matrix, the data require
- Page 127 and 128: tency of the cumulative and conditi
- Page 129 and 130: to internal back-testing results in
- Page 131 and 132: Changes in correlations One of the
- Page 133 and 134: 6.4.3 Developing Stress Tests This
- Page 135 and 136: Counterparty-based and credit facil
- Page 137 and 138: tify decisive factors influencing i
- Page 139 and 140: III ESTIMATING AND VALIDATING LGD/E
- Page 141 and 142: Chart 81: Loss Components in LGD to
- Page 143 and 144: assets, as the danger exists that m
- Page 145 and 146: — Collateral: Collateral value, c
- Page 147 and 148: Chart 87: Overview of Customer Type
- Page 149 and 150: transaction, however, it is also ne
- Page 151 and 152: Implementing an in-house LGD estima
- Page 153 and 154: nents; this is analogous to the use
- Page 155 and 156: those assets which serve as collate
- Page 157 and 158: during the realization period. The
- Page 159 and 160: Chart 91: Example of Segmentation f
- Page 161 and 162: ity of the realization market and t
- Page 163 and 164: The level of utilization for off-ba
- Page 165: 8.3 EAD Estimation Methods As in th
- Page 169 and 170: Stuhlinger, Matthias, Rolle von Rat
- Page 171 and 172: Pytlik, Martin, Diskriminanzanalyse