RURAL BANGLADESH - PreventionWeb
RURAL BANGLADESH - PreventionWeb
RURAL BANGLADESH - PreventionWeb

Create successful ePaper yourself
Turn your PDF publications into a flip-book with our unique Google optimized e-Paper software.
Socioeconomic Profiles of WFP Operational Areas and Beneficiaries<br />
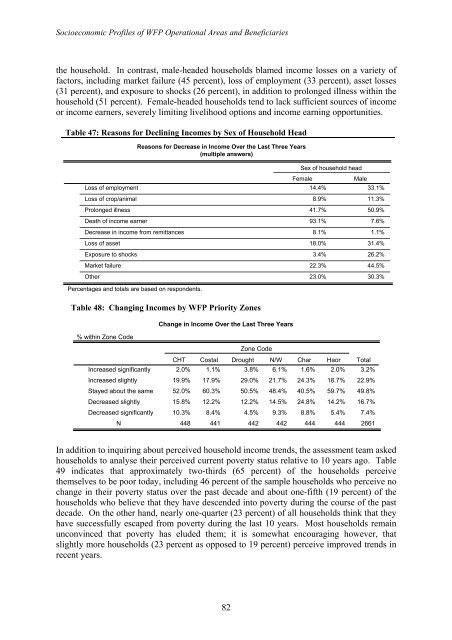
the household. In contrast, male-headed households blamed income losses on a variety of<br />
factors, including market failure (45 percent), loss of employment (33 percent), asset losses<br />
(31 percent), and exposure to shocks (26 percent), in addition to prolonged illness within the<br />
household (51 percent). Female-headed households tend to lack sufficient sources of income<br />
or income earners, severely limiting livelihood options and income earning opportunities.<br />
Table 47: Reasons for Declining Incomes by Sex of Household Head<br />
Loss of employment<br />
Loss of crop/animal<br />
Prolonged illness<br />
Death of income earner<br />
Decrease in income from remittances<br />
Loss of asset<br />
Exposure to shocks<br />
Market failure<br />
Other<br />
Percentages and totals are based on respondents.<br />
% within Zone Code<br />
Reasons for Decrease in Income Over the Last Three Years<br />
(multiple answers)<br />
Table 48: Changing Incomes by WFP Priority Zones<br />
Increased significantly<br />
Increased slightly<br />
Stayed about the same<br />
Decreased slightly<br />
Decreased significantly<br />
N<br />
Change in Income Over the Last Three Years<br />
82<br />
Zone Code<br />
Sex of household head<br />
Female Male<br />
14.4% 33.1%<br />
8.9% 11.3%<br />
41.7% 50.9%<br />
93.1% 7.6%<br />
8.1% 1.1%<br />
18.0% 31.4%<br />
3.4% 26.2%<br />
22.3% 44.5%<br />
23.0% 30.3%<br />
CHT Costal Drought N/W Char Haor Total<br />
2.0% 1.1% 3.8% 6.1% 1.6% 2.0% 3.2%<br />
19.9% 17.9% 29.0% 21.7% 24.3% 18.7% 22.9%<br />
52.0% 60.3% 50.5% 48.4% 40.5% 59.7% 49.8%<br />
15.8% 12.2% 12.2% 14.5% 24.8% 14.2% 16.7%<br />
10.3% 8.4% 4.5% 9.3% 8.8% 5.4% 7.4%<br />
448 441 442 442 444 444 2661<br />
In addition to inquiring about perceived household income trends, the assessment team asked<br />
households to analyse their perceived current poverty status relative to 10 years ago. Table<br />
49 indicates that approximately two-thirds (65 percent) of the households perceive<br />
themselves to be poor today, including 46 percent of the sample households who perceive no<br />
change in their poverty status over the past decade and about one-fifth (19 percent) of the<br />
households who believe that they have descended into poverty during the course of the past<br />
decade. On the other hand, nearly one-quarter (23 percent) of all households think that they<br />
have successfully escaped from poverty during the last 10 years. Most households remain<br />
unconvinced that poverty has eluded them; it is somewhat encouraging however, that<br />
slightly more households (23 percent as opposed to 19 percent) perceive improved trends in<br />
recent years.


![View full document [PDF 988.55 KB] - PreventionWeb](https://img.yumpu.com/47733942/1/184x260/view-full-document-pdf-98855-kb-preventionweb.jpg?quality=85)
![View full document (in French) [PDF 4.96 MB] - PreventionWeb](https://img.yumpu.com/47223870/1/184x260/view-full-document-in-french-pdf-496-mb-preventionweb.jpg?quality=85)

![View full document [PDF 25.02 MB] - PreventionWeb](https://img.yumpu.com/44204570/1/190x234/view-full-document-pdf-2502-mb-preventionweb.jpg?quality=85)