RURAL BANGLADESH - PreventionWeb
RURAL BANGLADESH - PreventionWeb
RURAL BANGLADESH - PreventionWeb

You also want an ePaper? Increase the reach of your titles
YUMPU automatically turns print PDFs into web optimized ePapers that Google loves.
Socioeconomic Profiles of WFP Operational Areas and Beneficiaries<br />
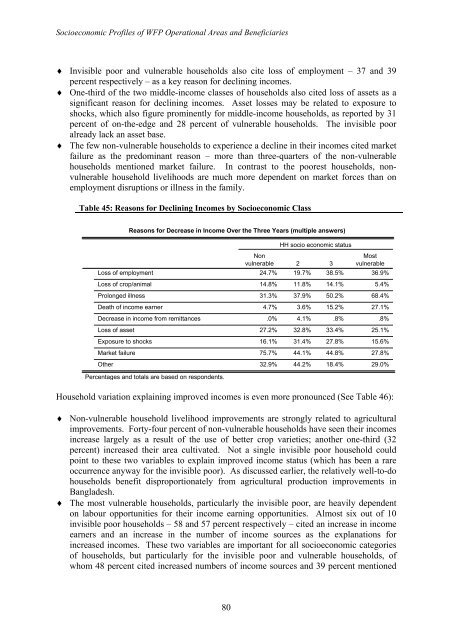
♦ Invisible poor and vulnerable households also cite loss of employment – 37 and 39<br />
percent respectively – as a key reason for declining incomes.<br />
♦ One-third of the two middle-income classes of households also cited loss of assets as a<br />
significant reason for declining incomes. Asset losses may be related to exposure to<br />
shocks, which also figure prominently for middle-income households, as reported by 31<br />
percent of on-the-edge and 28 percent of vulnerable households. The invisible poor<br />
already lack an asset base.<br />
♦ The few non-vulnerable households to experience a decline in their incomes cited market<br />
failure as the predominant reason – more than three-quarters of the non-vulnerable<br />
households mentioned market failure. In contrast to the poorest households, nonvulnerable<br />
household livelihoods are much more dependent on market forces than on<br />
employment disruptions or illness in the family.<br />
Table 45: Reasons for Declining Incomes by Socioeconomic Class<br />
Loss of employment<br />
Loss of crop/animal<br />
Prolonged illness<br />
Reasons for Decrease in Income Over the Three Years (multiple answers)<br />
Death of income earner<br />
Decrease in income from remittances<br />
Loss of asset<br />
Exposure to shocks<br />
Market failure<br />
Other<br />
Percentages and totals are based on respondents.<br />
80<br />
HH socio economic status<br />
Non<br />
vulnerable 2 3<br />
Most<br />
vulnerable<br />
24.7% 19.7% 38.5% 36.9%<br />
14.8% 11.8% 14.1% 5.4%<br />
31.3% 37.9% 50.2% 68.4%<br />
4.7% 3.6% 15.2% 27.1%<br />
.0% 4.1% .8% .8%<br />
27.2% 32.8% 33.4% 25.1%<br />
16.1% 31.4% 27.8% 15.6%<br />
75.7% 44.1% 44.8% 27.8%<br />
32.9% 44.2% 18.4% 29.0%<br />
Household variation explaining improved incomes is even more pronounced (See Table 46):<br />
♦ Non-vulnerable household livelihood improvements are strongly related to agricultural<br />
improvements. Forty-four percent of non-vulnerable households have seen their incomes<br />
increase largely as a result of the use of better crop varieties; another one-third (32<br />
percent) increased their area cultivated. Not a single invisible poor household could<br />
point to these two variables to explain improved income status (which has been a rare<br />
occurrence anyway for the invisible poor). As discussed earlier, the relatively well-to-do<br />
households benefit disproportionately from agricultural production improvements in<br />
Bangladesh.<br />
♦ The most vulnerable households, particularly the invisible poor, are heavily dependent<br />
on labour opportunities for their income earning opportunities. Almost six out of 10<br />
invisible poor households – 58 and 57 percent respectively – cited an increase in income<br />
earners and an increase in the number of income sources as the explanations for<br />
increased incomes. These two variables are important for all socioeconomic categories<br />
of households, but particularly for the invisible poor and vulnerable households, of<br />
whom 48 percent cited increased numbers of income sources and 39 percent mentioned


![View full document [PDF 988.55 KB] - PreventionWeb](https://img.yumpu.com/47733942/1/184x260/view-full-document-pdf-98855-kb-preventionweb.jpg?quality=85)
![View full document (in French) [PDF 4.96 MB] - PreventionWeb](https://img.yumpu.com/47223870/1/184x260/view-full-document-in-french-pdf-496-mb-preventionweb.jpg?quality=85)

![View full document [PDF 25.02 MB] - PreventionWeb](https://img.yumpu.com/44204570/1/190x234/view-full-document-pdf-2502-mb-preventionweb.jpg?quality=85)