RURAL BANGLADESH - PreventionWeb
RURAL BANGLADESH - PreventionWeb
RURAL BANGLADESH - PreventionWeb

You also want an ePaper? Increase the reach of your titles
YUMPU automatically turns print PDFs into web optimized ePapers that Google loves.
Socioeconomic Profile Findings<br />
households. Female-headed households are also burdened with a higher dependency ratio;<br />
coupled with fewer potential income earning individuals within the household, they face<br />
more difficulties in diversifying household income sources and therefore realizing livelihood<br />
or food security. Significant differences in literacy rates by sex of household head, discussed<br />
in the Education section below, shows a further disadvantage faced by female household<br />
heads.<br />
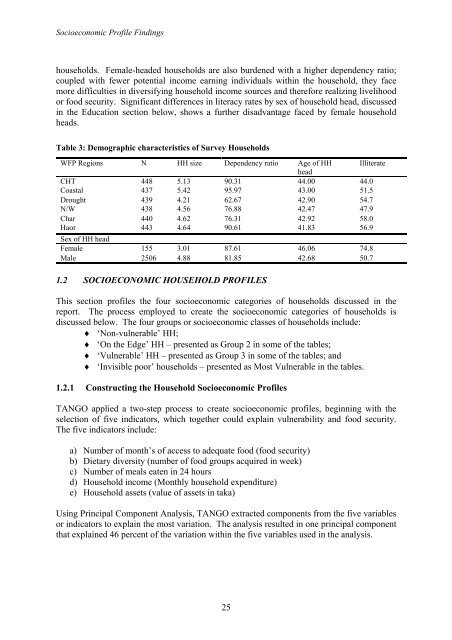
Table 3: Demographic characteristics of Survey Households<br />
WFP Regions N HH size Dependency ratio Age of HH<br />
head<br />
Illiterate<br />
CHT 448 5.13 90.31 44.00 44.0<br />
Coastal 437 5.42 95.97 43.00 51.5<br />
Drought 439 4.21 62.67 42.90 54.7<br />
N/W 438 4.56 76.88 42.47 47.9<br />
Char 440 4.62 76.31 42.92 58.0<br />
Haor<br />
Sex of HH head<br />
443 4.64 90.61 41.83 56.9<br />
Female 155 3.01 87.61 46.06 74.8<br />
Male 2506 4.88 81.85 42.68 50.7<br />
1.2 SOCIOECONOMIC HOUSEHOLD PROFILES<br />
This section profiles the four socioeconomic categories of households discussed in the<br />
report. The process employed to create the socioeconomic categories of households is<br />
discussed below. The four groups or socioeconomic classes of households include:<br />
♦ ‘Non-vulnerable’ HH;<br />
♦ ‘On the Edge’ HH – presented as Group 2 in some of the tables;<br />
♦ ‘Vulnerable’ HH – presented as Group 3 in some of the tables; and<br />
♦ ‘Invisible poor’ households – presented as Most Vulnerable in the tables.<br />
1.2.1 Constructing the Household Socioeconomic Profiles<br />
TANGO applied a two-step process to create socioeconomic profiles, beginning with the<br />
selection of five indicators, which together could explain vulnerability and food security.<br />
The five indicators include:<br />
a) Number of month’s of access to adequate food (food security)<br />
b) Dietary diversity (number of food groups acquired in week)<br />
c) Number of meals eaten in 24 hours<br />
d) Household income (Monthly household expenditure)<br />
e) Household assets (value of assets in taka)<br />
Using Principal Component Analysis, TANGO extracted components from the five variables<br />
or indicators to explain the most variation. The analysis resulted in one principal component<br />
that explained 46 percent of the variation within the five variables used in the analysis.<br />
25


![View full document [PDF 988.55 KB] - PreventionWeb](https://img.yumpu.com/47733942/1/184x260/view-full-document-pdf-98855-kb-preventionweb.jpg?quality=85)
![View full document (in French) [PDF 4.96 MB] - PreventionWeb](https://img.yumpu.com/47223870/1/184x260/view-full-document-in-french-pdf-496-mb-preventionweb.jpg?quality=85)

![View full document [PDF 25.02 MB] - PreventionWeb](https://img.yumpu.com/44204570/1/190x234/view-full-document-pdf-2502-mb-preventionweb.jpg?quality=85)