- Page 1 and 2:
SYNTHESIS AND CHARACTERIZATION OF L
- Page 3 and 4:
STATEMENT BY AUTHOR This dissertati
- Page 5 and 6:
Dedicated to ……… My beloved b
- Page 7 and 8:
also thankful to all the members of
- Page 9 and 10:
2.3 Synthesis of binary oxide nanom
- Page 11 and 12:
CHAPTER 5: Zinc Gallate ...........
- Page 13 and 14:
imaging, scintillators, lasers, etc
- Page 15 and 16:
morphology by heating at 500 and 90
- Page 17 and 18:
nanoparticles having hexagonal stru
- Page 19 and 20:
100°C and 185°C, respectively in
- Page 21 and 22:
into poly methyl methacryllate (PMM
- Page 23 and 24:
3. N. M. Dimitrijevic, Z. V. Saponj
- Page 25 and 26:
Fig.13: Fig.14: (a) Simplified ray
- Page 27 and 28:
Eu 3+ ions after heat treatment at
- Page 29 and 30:
615 nm Fig.50: FT-IR patterns (a) a
- Page 31 and 32:
area electron diffraction pattern a
- Page 33 and 34:
different amounts of Eu 3+ . Fig.86
- Page 35 and 36:
and 545 nm, respectively. Fig.106:
- Page 37 and 38:
List of Tables: Table 1: Variation
- Page 39 and 40:
CHAPTER 1: Introduction 1.1 Histori
- Page 41 and 42:
Rods, cylinders, wires and tubes ar
- Page 43 and 44:
must be supersaturated either by di
- Page 45 and 46:
- + - + charge stabilized nanoparti
- Page 47 and 48:
exothermic reaction between the met
- Page 49 and 50:
constant, ħ is h/2π, e is the ele
- Page 51 and 52:
these platinum complexes have been
- Page 53 and 54:
(IR), visible and ultra-violet (UV)
- Page 55 and 56:
in Ce 3+ , Pr 3+ , Tb 3+ and CT abs
- Page 57 and 58:
assisted by lattice phonons of appr
- Page 59 and 60:
decay-time reduction is much easier
- Page 61 and 62:
nanocrystals is shown in Fig.10 [58
- Page 63 and 64:
depends strongly on the nature of t
- Page 65 and 66:
corresponding emission and excitati
- Page 67 and 68:
doped nanomaterials of the above me
- Page 69 and 70:
will be formed and subsequently it
- Page 71 and 72:
Eu 3+ ions were also subjected to s
- Page 73 and 74:
transferred into a two-necked RB fl
- Page 75 and 76:
Where λ is the wavelength of X-ray
- Page 77 and 78:
Micro-structural characterization b
- Page 79 and 80:
electrons (i.e. diffraction mode).
- Page 81 and 82: diffraction spots. By tilting a cry
- Page 83 and 84: surface. The contact mode can obtai
- Page 85 and 86: three types lines in the scattered
- Page 87 and 88: solids tend to be broadened because
- Page 89 and 90: sample fluoresce. The fluorescent l
- Page 91 and 92: pulse frequency) as excitation sour
- Page 93 and 94: Lanthanide ions doped Ga 2 O 3 nano
- Page 95 and 96: atoms at three corners and the lone
- Page 97 and 98: Figure 19 (a-d) shows SEM images of
- Page 99 and 100: Based on these results, it can be i
- Page 101 and 102: almost normal to the equatorial pla
- Page 103 and 104: Table 2. Summary of important modes
- Page 105 and 106: systematic disappearance of these t
- Page 107 and 108: comparison, Eu 3+ ions alone in wat
- Page 109 and 110: the samples, suggesting that Eu 3+
- Page 111 and 112: These inferences are further substa
- Page 113 and 114: Similar DTA peaks have been reporte
- Page 115 and 116: GaOOH samples doped with different
- Page 117 and 118: The cell parameters increases with
- Page 119 and 120: strong emission compared to corresp
- Page 121 and 122: curves are shown in Fig.39. Lifetim
- Page 123 and 124: Similar results are also observed f
- Page 125 and 126: intensity of XRD peaks correspond t
- Page 127 and 128: compared to the bulk material and a
- Page 129 and 130: is almost 1½ times that of peak B1
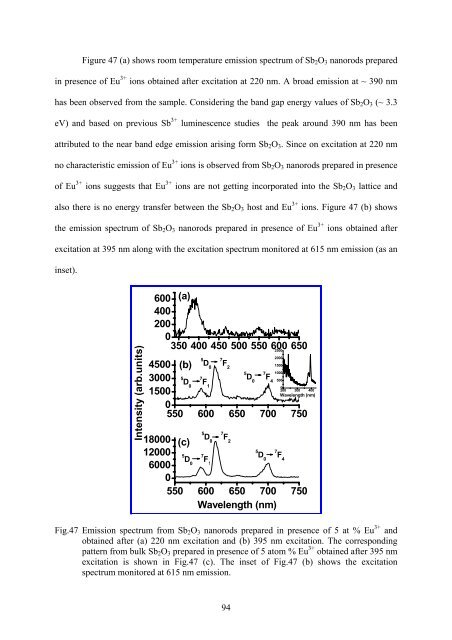
- Page 131: 3.8 Interaction of Eu 3+ ions with
- Page 135 and 136: The decay curves are found to be bi
- Page 137 and 138: As prepared undoped Sb 2 O 3 sample
- Page 139 and 140: Intensity(arb.units) 1.0 0.8 0.6 0.
- Page 141 and 142: 3+ having surface lanthanide ions.
- Page 143 and 144: diffraction patterns from the GaPO
- Page 145 and 146: 5 D 0 7 F 2 level to 7 F 7 7 1 , F
- Page 147 and 148: The second possibility is the excha
- Page 149 and 150: chemical shift anisotropy is much h
- Page 151 and 152: not have strong interaction with th
- Page 153 and 154: (001) (110) (011) (101) (020) (101)
- Page 155 and 156: growth centre compared to higher vi
- Page 157 and 158: observed after excitation at 250 an
- Page 159 and 160: 3+ 3+ concentration quenching. Tb l
- Page 161 and 162: Compared to the selected area elect
- Page 163 and 164: lattice. Lanthanide ions occupying
- Page 165 and 166: obtained after 275 nm excitation is
- Page 167 and 168: The luminescence dynamics associate
- Page 169 and 170: that the broad peak can be resolved
- Page 171 and 172: espectively. Value of this integral
- Page 173 and 174: ethylene glycol moiety (stabilizing
- Page 175 and 176: Room temperature and 100°C synthes
- Page 177 and 178: heavier metal ion as compared to La
- Page 179 and 180: Similar studies were also carried o
- Page 181 and 182: 3+ 3+ faster decay component is ass
- Page 183 and 184:
the other hand the Eu 3+ lifetime h
- Page 185 and 186:
3+ 4.4.8 Luminescence studies on Sm
- Page 187 and 188:
CHAPTER 5: Zinc gallate (ZnGa 2 O 4
- Page 189 and 190:
In pure EG an amorphous product is
- Page 191 and 192:
water content in the reaction mediu
- Page 193 and 194:
nucleation, thereby leading to incr
- Page 195 and 196:
particles. Thus the TEM studies als
- Page 197 and 198:
value. The lattice parameters calcu
- Page 199 and 200:
Quantum yield of the blue emission
- Page 201 and 202:
5.5.2. Eu 3+ doped ZnGa 1.5 In 0.5
- Page 203 and 204:
CHAPTER 6: Tungstates [MWO 4 (M = C
- Page 205 and 206:
ionic radius of the metal cation ca
- Page 207 and 208:
lattice. Asymmetric ratio is ~ 12 f
- Page 209 and 210:
700 Intensity (arb.units) 600 λ ex
- Page 211 and 212:
Intensity (arb.units) 25000 20000 1
- Page 213 and 214:
Strong green emission has been obse
- Page 215 and 216:
consists of strong band at 255 nm a
- Page 217 and 218:
peak can be attributed to the cryst
- Page 219 and 220:
nm) is observed from Er 3+ doped Ga
- Page 221 and 222:
and Dy 3+ doped CaWO 4 nanoparticle
- Page 223 and 224:
REFERENCES 1. D. J. Barber, I. C. F
- Page 225 and 226:
32. K. A. Gschneidner, Jr., L. Eyri
- Page 227 and 228:
65. Z. Deng, F. Tang, D. Chen, X. M
- Page 229 and 230:
100. A. Rouanel, J. J. Serra, K. Al
- Page 231 and 232:
130. F. Li, W. Jianhuai, L. Jiongti
- Page 233 and 234:
166. L. Fu, Z. Liu, Y. Liu, B. Han,
- Page 235 and 236:
205. R. Sasikala, V. Sudarsan, C. S
- Page 237 and 238:
238. E. Oldfield, R. A. Kinsey, K.
- Page 239 and 240:
271. B. G. Hyde, S. Andersson, ”I
- Page 241 and 242:
B. S. Naidu, B. Vishwanadh, V. Suda
- Page 243:
9. Room temperature synthesis of mu