

CHEM01200604004 Shri Sanyasinaidu Boddu - Homi Bhabha ...
CHEM01200604004 Shri Sanyasinaidu Boddu - Homi Bhabha ...
CHEM01200604004 Shri Sanyasinaidu Boddu - Homi Bhabha ...

Create successful ePaper yourself
Turn your PDF publications into a flip-book with our unique Google optimized e-Paper software.
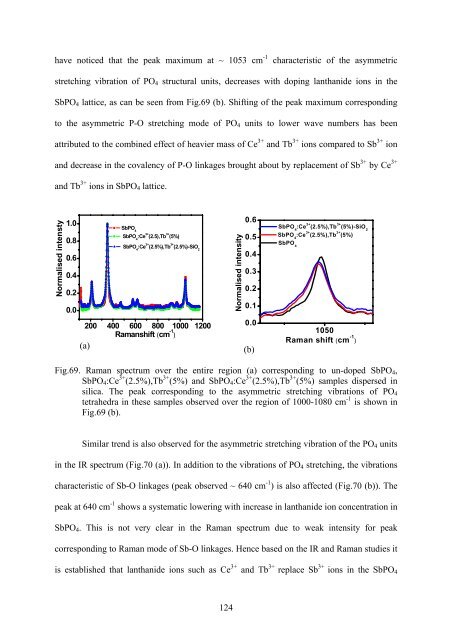
have noticed that the peak maximum at ~ 1053 cm -1<br />
characteristic of the asymmetric<br />
stretching vibration of PO 4 structural units, decreases with doping lanthanide ions in the<br />
SbPO 4 lattice, as can be seen from Fig.69 (b). Shifting of the peak maximum corresponding<br />
to the asymmetric P-O stretching mode of PO 4 units to lower wave numbers has been<br />
3+ 3+ 3+<br />
attributed to the combined effect of heavier mass of Ce and Tb ions compared to Sb ion<br />
3+ 3+<br />
and decrease in the covalency of P-O linkages brought about by replacement of Sb by Ce<br />
and Tb 3+ ions in SbPO lattice. 4<br />
Normalised intensty<br />
1.0<br />
0.8<br />
0.6<br />
0.4<br />
0.2<br />
0.0<br />
SbPO 4<br />
SbPO 4<br />
:Ce 3+ (2.5),Tb 3+ (5%)<br />
Normalised intensity<br />
0.6<br />
0.5<br />
0.4<br />
0.3<br />
0.2<br />
0.1<br />
SbPO 4<br />
:Ce 3+ (2.5%),Tb 3+ (5%)-SiO 2<br />
SbPO 4<br />
:Ce 3+ (2.5%),Tb 3+ (5%)<br />
SbPO 4<br />
SbPO 4<br />
:Ce 3+ (2.5%),Tb 3+ (2.5%)-SiO 2<br />
0.0<br />
200 400 600 800 1000 1200<br />
Ramanshift (cm -1 )<br />
(a)<br />
(b)<br />
1050<br />
Raman shift (cm -1 )<br />
Fig.69. Raman spectrum over the entire region (a) corresponding to un-doped SbPO 4 ,<br />
3+<br />
3+ 3+<br />
SbPO4:Ce (2.5%),Tb (5%) and SbPO 4 :Ce (2.5%),Tb 3+ (5%) samples dispersed in<br />
silica. The peak corresponding to the asymmetric stretching vibrations of PO 4<br />
tetrahedra in these samples observed over the region of 1000-1080 cm -1 is shown in<br />
Fig.69 (b).<br />
Similar trend is also observed for the asymmetric stretching vibration of the PO 4 units<br />
in the IR spectrum (Fig.70 (a)). In addition to the vibrations of PO 4 stretching, the vibrations<br />
characteristic of Sb-O linkages (peak observed ~ 640 cm -1 ) is also affected (Fig.70 (b)). The<br />
peak at 640 cm -1 shows a systematic lowering with increase in lanthanide ion concentration in<br />
SbPO 4 . This is not very clear in the Raman spectrum due to weak intensity for peak<br />
corresponding to Raman mode of Sb-O linkages. Hence based on the IR and Raman studies it<br />
3+ 3+<br />
is established that lanthanide ions such as Ce and Tb replace Sb 3+ ions in the SbPO 4<br />
124


