

CHEM01200604005 A. K. Pathak - Homi Bhabha National Institute
CHEM01200604005 A. K. Pathak - Homi Bhabha National Institute
CHEM01200604005 A. K. Pathak - Homi Bhabha National Institute

You also want an ePaper? Increase the reach of your titles
YUMPU automatically turns print PDFs into web optimized ePapers that Google loves.
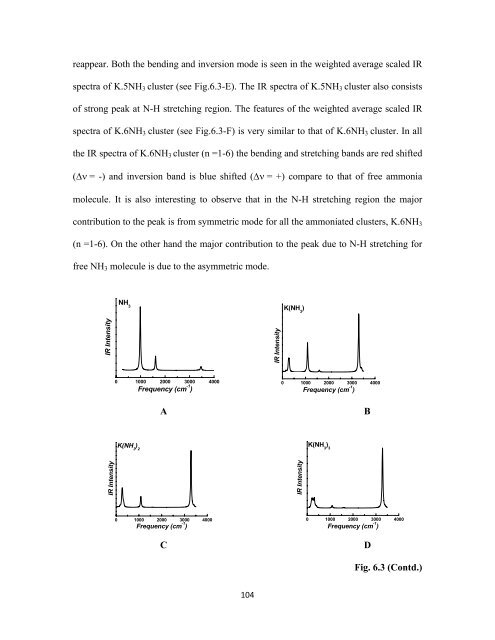
eappear. Both the bending and inversion mode is seen in the weighted average scaled IR<br />
spectra of K.5NH 3 cluster (see Fig.6.3-E). The IR spectra of K.5NH 3 cluster also consists<br />
of strong peak at N-H stretching region. The features of the weighted average scaled IR<br />
spectra of K.6NH 3 cluster (see Fig.6.3-F) is very similar to that of K.6NH 3 cluster. In all<br />
the IR spectra of K.6NH 3 cluster (n =1-6) the bending and stretching bands are red shifted<br />
(Δν = -) and inversion band is blue shifted (Δν = +) compare to that of free ammonia<br />
molecule. It is also interesting to observe that in the N-H stretching region the major<br />
contribution to the peak is from symmetric mode for all the ammoniated clusters, K.6NH 3<br />
(n =1-6). On the other hand the major contribution to the peak due to N-H stretching for<br />
free NH 3 molecule is due to the asymmetric mode.<br />
NH 3<br />
K(NH 3<br />
)<br />
IR Intensity<br />
0 1000 2000 3000 4000<br />
Frequency (cm -1 )<br />
A<br />
B<br />
K(NH 3<br />
) 2<br />
K(NH 3<br />
) 3<br />
IR Intensity<br />
IR Intensity<br />
IR Intensity<br />
0 1000 2000 3000 4000<br />
Frequency (cm -1 )<br />
0 1000 2000 3000 4000<br />
Frequency (cm -1 )<br />
C<br />
0 1000 2000 3000 4000<br />
Frequency (cm -1 )<br />
D<br />
Fig. 6.3 (Contd.)<br />
104


