

CHEM01200604005 A. K. Pathak - Homi Bhabha National Institute
CHEM01200604005 A. K. Pathak - Homi Bhabha National Institute
CHEM01200604005 A. K. Pathak - Homi Bhabha National Institute

You also want an ePaper? Increase the reach of your titles
YUMPU automatically turns print PDFs into web optimized ePapers that Google loves.
3350-3500 cm -1 (scaling factor ~0.93) and 3500-3650 cm -1 (scaling factor ~0.90). The<br />
actual scaling factor is obtained by comparing the harmonic frequency with the<br />
experimentally observed spectrum. As large number of minimum energy structures are<br />
found, weighted average IR spectra are calculated which can be best comparable to the<br />
experimental spectra. The weight factor is calculated based on Boltzmann population at<br />
100K. The weight factor is also calculated at a temperature range from 75K to 200K as<br />
the cluster experiment (NVE ensemble) is carried out in this low temperature range. The<br />
calculated IR spectra ~100K for all this three systems are close to the experimental<br />
spectra. So, based on this scaling factor, weighted average scaled IR spectra are<br />
calculated at 100K for Cl •− 2 .nH 2 O (n=3-5) and are shown in Fig. 3.4(II) along with the<br />
experimental spectrum. An excellent agreement with experimental results is observed.<br />
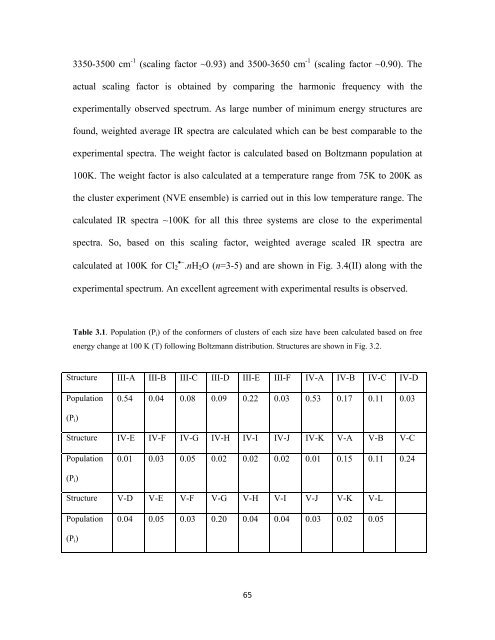
Table 3.1. Population (P i ) of the conformers of clusters of each size have been calculated based on free<br />
energy change at 100 K (T) following Boltzmann distribution. Structures are shown in Fig. 3.2.<br />
Structure III-A III-B III-C III-D III-E III-F IV-A IV-B IV-C IV-D<br />
Population<br />
0.54 0.04 0.08 0.09 0.22 0.03 0.53 0.17 0.11 0.03<br />
(P i )<br />
Structure IV-E IV-F IV-G IV-H IV-I IV-J IV-K V-A V-B V-C<br />
Population<br />
0.01 0.03 0.05 0.02 0.02 0.02 0.01 0.15 0.11 0.24<br />
(P i )<br />
Structure V-D V-E V-F V-G V-H V-I V-J V-K V-L<br />
Population<br />
0.04 0.05 0.03 0.20 0.04 0.04 0.03 0.02 0.05<br />
(P i )<br />
65


