

PDF file - Department of Health and Ageing
PDF file - Department of Health and Ageing
PDF file - Department of Health and Ageing

Create successful ePaper yourself
Turn your PDF publications into a flip-book with our unique Google optimized e-Paper software.
Tuberculosis notifications in Australia, 2004<br />
Annual report<br />
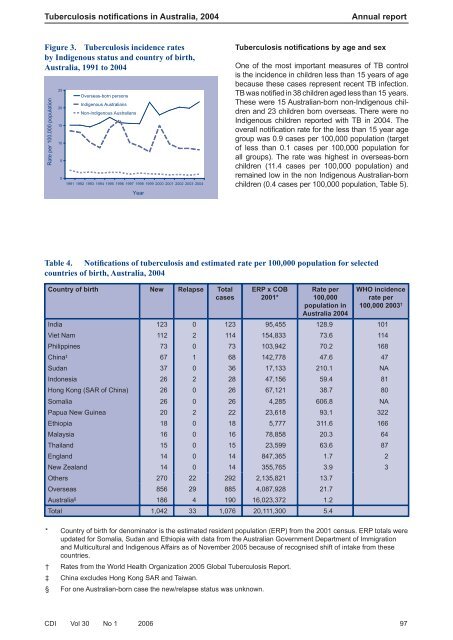
Figure 3. Tuberculosis incidence rates<br />
by Indigenous status <strong>and</strong> country <strong>of</strong> birth,<br />
Australia, 1991 to 2004<br />
Rate per 100,000 population<br />
25<br />
20<br />
15<br />
10<br />
5<br />
0<br />
Overseas-born persons<br />
Indigenous Australians<br />
Non-indigenous Australians<br />
1991 1992 1993 1994 1995 1996 1997 1998 1999 2000 2001 2002 2003 2004<br />
Year<br />
Tuberculosis notifications by age <strong>and</strong> sex<br />
One <strong>of</strong> the most important measures <strong>of</strong> TB control<br />
is the incidence in children less than 15 years <strong>of</strong> age<br />
because these cases represent recent TB infection.<br />
TB was notified in 38 children aged less than 15 years.<br />
These were 15 Australian-born non-Indigenous children<br />
<strong>and</strong> 23 children born overseas. There were no<br />
Indigenous children reported with TB in 2004. The<br />
overall notification rate for the less than 15 year age<br />
group was 0.9 cases per 100,000 population (target<br />
<strong>of</strong> less than 0.1 cases per 100,000 population for<br />
all groups). The rate was highest in overseas-born<br />
children (11.4 cases per 100,000 population) <strong>and</strong><br />
remained low in the non Indigenous Australian-born<br />
children (0.4 cases per 100,000 population, Table 5).<br />
Table 4. Notifications <strong>of</strong> tuberculosis <strong>and</strong> estimated rate per 100,000 population for selected<br />
countries <strong>of</strong> birth, Australia, 2004<br />
Country <strong>of</strong> birth New Relapse Total<br />
cases<br />
ERP x COB<br />
2001*<br />
Rate per<br />
100,000<br />
population in<br />
Australia 2004<br />
WHO incidence<br />
rate per<br />
100,000 2003 †<br />
India 123 0 123 95,455 128.9 101<br />
Viet Nam 112 2 114 154,833 73.6 114<br />
Philippines 73 0 73 103,942 70.2 168<br />
China ‡ 67 1 68 142,778 47.6 47<br />
Sudan 37 0 36 17,133 210.1 NA<br />
Indonesia 26 2 28 47,156 59.4 81<br />
Hong Kong (SAR <strong>of</strong> China) 26 0 26 67,121 38.7 80<br />
Somalia 26 0 26 4,285 606.8 NA<br />
Papua New Guinea 20 2 22 23,618 93.1 322<br />
Ethiopia 18 0 18 5,777 311.6 166<br />
Malaysia 16 0 16 78,858 20.3 64<br />
Thail<strong>and</strong> 15 0 15 23,599 63.6 87<br />
Engl<strong>and</strong> 14 0 14 847,365 1.7 2<br />
New Zeal<strong>and</strong> 14 0 14 355,765 3.9 3<br />
Others 270 22 292 2,135,821 13.7<br />
Overseas 856 29 885 4,087,928 21.7<br />
Australia § 186 4 190 16,023,372 1.2<br />
Total 1,042 33 1,076 20,111,300 5.4<br />
* Country <strong>of</strong> birth for denominator is the estimated resident population (ERP) from the 2001 census. ERP totals were<br />
updated for Somalia, Sudan <strong>and</strong> Ethiopia with data from the Australian Government <strong>Department</strong> <strong>of</strong> Immigration<br />
<strong>and</strong> Multicultural <strong>and</strong> Indigenous Affairs as <strong>of</strong> November 2005 because <strong>of</strong> recognised shift <strong>of</strong> intake from these<br />
countries.<br />
† Rates from the World <strong>Health</strong> Organization 2005 Global Tuberculosis Report.<br />
‡ China excludes Hong Kong SAR <strong>and</strong> Taiwan.<br />
§ For one Australian-born case the new/relapse status was unknown.<br />
CDI Vol 30 No 1 2006 97


