

PDF file - Department of Health and Ageing
PDF file - Department of Health and Ageing
PDF file - Department of Health and Ageing

You also want an ePaper? Increase the reach of your titles
YUMPU automatically turns print PDFs into web optimized ePapers that Google loves.
Annual report Australian Rotavirus Surveillance Program, 2004-05<br />
panel <strong>of</strong> MAbs specific for the major glycoprotein VP7<br />
<strong>of</strong> the outer capsid <strong>of</strong> the five major group A human<br />
rotavirus serotypes (G1, G2, G3, G4 <strong>and</strong> G9). 6<br />
Strains which could not be assigned a G serotype<br />
were genotyped by reverse transcription/polymerase<br />
chain reaction (RT/PCR), using serotype specific<br />
oligonucleotide primers. 7 Polyacrylamide gel electrophoresis<br />
(PAGE) was used to classify rotavirus strains<br />
genetically into electropherotypes, <strong>and</strong> to examine<br />
the extent <strong>of</strong> sharing <strong>of</strong> the same electropherotype<br />
between collaborating centres.<br />
Results<br />
Number <strong>of</strong> isolates<br />
A total <strong>of</strong> 612 specimens were received for analysis<br />
from Melbourne <strong>and</strong> the collaborating centres<br />
in Western Australia, the Northern Territory, New<br />
South Wales, <strong>and</strong> South Australia. Five hundred <strong>and</strong><br />
sixty-eight specimens were confi rmed as rotavirus<br />
positive using our in-house EIA assay. Specimens<br />
containing insuffi cient specimen for testing, or<br />
specimens that were not confi rmed to be positive for<br />
rotavirus (n=44) were not analysed further.<br />
Children under 12 months <strong>of</strong> age were more likely<br />
to have a G3 infection (51.6%) than those aged<br />
13–24 months (29.4%). In Alice Springs <strong>and</strong> Darwin<br />
68.7 per cent <strong>of</strong> children with a serotype G3 infection<br />
were aged 12 months or less. Other serotypes (G1,<br />
G2 or G9) were equally common in children under<br />
12 months (38.3%) <strong>and</strong> in those aged 13–24 months<br />
(31.5%).<br />
Serotype distribution<br />
The rotavirus serotypes identifi ed in Australia from<br />
1 July 2004 to 30 June 2005 are shown in the Table.<br />
Serotype G1 was the most common, representing<br />
48.2 per cent <strong>of</strong> all specimens. It was the dominant<br />
strain in four <strong>of</strong> the eight centres (Melbourne,<br />
Sydney (POW, Westmead), Adelaide), <strong>and</strong> was the<br />
second most common type in the remaining centres.<br />
Serotype G3 was the second most common<br />
serotype nationally, <strong>and</strong> represented 36.6 per cent<br />
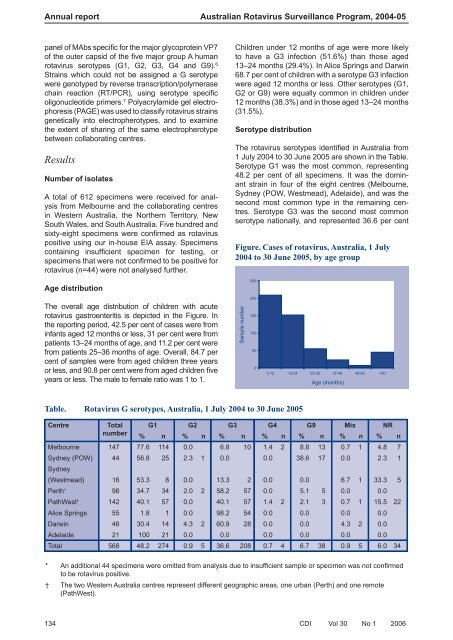
Figure. Cases <strong>of</strong> rotavirus, Australia, 1 July<br />
2004 to 30 June 2005, by age group<br />
Age distribution<br />
250<br />
The overall age distribution <strong>of</strong> children with acute<br />
rotavirus gastroenteritis is depicted in the Figure. In<br />
the reporting period, 42.5 per cent <strong>of</strong> cases were from<br />
infants aged 12 months or less, 31 per cent were from<br />
patients 13–24 months <strong>of</strong> age, <strong>and</strong> 11.2 per cent were<br />
from patients 25–36 months <strong>of</strong> age. Overall, 84.7 per<br />
cent <strong>of</strong> samples were from aged children three years<br />
or less, <strong>and</strong> 90.8 per cent were from aged children five<br />
years or less. The male to female ratio was 1 to 1.<br />
Sample number<br />
200<br />
150<br />
100<br />
50<br />
0<br />
0-12 13-24 25-36 37-48 49-60 >60<br />
Age (months)<br />
Table. Rotavirus G serotypes, Australia, 1 July 2004 to 30 June 2005<br />
Centre<br />
Total G1 G2 G3 G4 G9 Mix NR<br />
number<br />
% n % n % n % n % n % n % n<br />
Melbourne 147 77.6 114 0.0 6.8 10 1.4 2 8.8 13 0.7 1 4.8 7<br />
Sydney (POW) 44 56.8 25 2.3 1 0.0 0.0 38.6 17 0.0 2.3 1<br />
Sydney<br />
(Westmead) 16 53.3 8 0.0 13.3 2 0.0 0.0 6.7 1 33.3 5<br />
Perth + 98 34.7 34 2.0 2 58.2 57 0.0 5.1 5 0.0 0.0<br />
PathWest † 142 40.1 57 0.0 40.1 57 1.4 2 2.1 3 0.7 1 15.5 22<br />
Alice Springs 55 1.8 1 0.0 98.2 54 0.0 0.0 0.0 0.0<br />
Darwin 46 30.4 14 4.3 2 60.9 28 0.0 0.0 4.3 2 0.0<br />
Adelaide 21 100 21 0.0 0.0 0.0 0.0 0.0 0.0<br />
Total 568 48.2 274 0.9 5 36.6 208 0.7 4 6.7 38 0.9 5 6.0 34<br />
* An additional 44 specimens were omitted from analysis due to insuffi cient sample or specimen was not confi rmed<br />
to be rotavirus positive.<br />
† The two Western Australia centres represent different geographic areas, one urban (Perth) <strong>and</strong> one remote<br />
(PathWest).<br />
134 CDI Vol 30 No 1 2006


