

PDF file - Department of Health and Ageing
PDF file - Department of Health and Ageing
PDF file - Department of Health and Ageing

Create successful ePaper yourself
Turn your PDF publications into a flip-book with our unique Google optimized e-Paper software.
National Notifiable Diseases Surveillance System, 2004<br />
Annual report<br />
The notifi cation rates for incident hepatitis C declined<br />
from 2001 to 2004 by 62 per cent in the 15–19 year<br />
age group, 60 per cent in the 20–29 year age<br />
group <strong>and</strong> 50 per cent in the 30–39 year age group<br />
(Figure 12).<br />
Figure 12. Trends in notification rates <strong>of</strong> incident<br />
hepatitis C infections, Australia, 1997 to 2004, by<br />
age group<br />
Rate per 100,000 population<br />
16<br />
14<br />
12<br />
10<br />
8<br />
6<br />
4<br />
2<br />
0<br />
1997 1998 1999 2000 2001 2002 2003 2004<br />
Year<br />
0-14<br />
15-19<br />
20-29<br />
30-39<br />
The exposure history <strong>of</strong> cases <strong>of</strong> incident hepatitis C<br />
was collected in the Australian Capital Territory,<br />
South Australia, Tasmania, Victoria <strong>and</strong> Western<br />
Australia in 2004 (Table 6). At least 70 per cent <strong>of</strong><br />
incident hepatitis C infections in 2004 were among<br />
injecting drug users.<br />
In 2004, an estimated 259,570 people were living<br />
with hepatitis C in Australia. Of these 65,300 people<br />
cleared their infection, 153,300 had chronic hepatitis<br />
C <strong>and</strong> early liver disease (stage 0/1), 32,800<br />
had chronic hepatitis C infection <strong>and</strong> moderate<br />
liver disease (stage 2/3) <strong>and</strong> 8,160 were living with<br />
hepatitis C related cirrhosis. 2<br />
Table 6. Incident hepatitis C infection,<br />
Australia,* 2004, by exposure category<br />
40+<br />
Hepatitis C (unspecified) notifications<br />
Case defi nition – Hepatitis C (unspecifi ed)<br />
Only confirmed cases are reported.<br />
Confirmed case: Requires detection <strong>of</strong> antihepatitis<br />
C antibody or detection <strong>of</strong> hepatitis C<br />
virus in a case who does not meet any <strong>of</strong> the<br />
criteria for a newly acquired case <strong>and</strong> is aged<br />
more than 24 months.<br />
National notifi cation rates <strong>of</strong> hepatitis C (unspecifi<br />
ed) infection ranged between 96 <strong>and</strong> 104 cases<br />
per 100,000 population in 1995–2001. The national<br />
rate declined to 81.3 in 2002 <strong>and</strong> to 63.7 cases per<br />
100,000 population in 2004 (Figure 10). Improved<br />
surveillance practice, such as better classifi cation<br />
<strong>of</strong> incident cases <strong>and</strong> increased duplicate checking<br />
may account for some <strong>of</strong> the decrease in hepatitis C<br />
(unspecifi ed) notifi cations.<br />
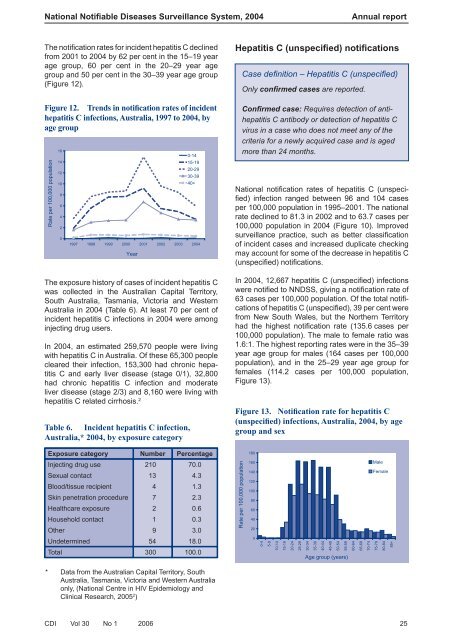
In 2004, 12,667 hepatitis C (unspecifi ed) infections<br />
were notifi ed to NNDSS, giving a notifi cation rate <strong>of</strong><br />
63 cases per 100,000 population. Of the total notifi -<br />
cations <strong>of</strong> hepatitis C (unspecifi ed), 39 per cent were<br />
from New South Wales, but the Northern Territory<br />
had the highest notifi cation rate (135.6 cases per<br />
100,000 population). The male to female ratio was<br />
1.6:1. The highest reporting rates were in the 35–39<br />
year age group for males (164 cases per 100,000<br />
population), <strong>and</strong> in the 25–29 year age group for<br />
females (114.2 cases per 100,000 population,<br />
Figure 13).<br />
Figure 13. Notification rate for hepatitis C<br />
(unspecified) infections, Australia, 2004, by age<br />
group <strong>and</strong> sex<br />
Exposure category Number Percentage<br />
180<br />
Injecting drug use 210 70.0<br />
Sexual contact 13 4.3<br />
Blood/tissue recipient 4 1.3<br />
Skin penetration procedure 7 2.3<br />
<strong>Health</strong>care exposure 2 0.6<br />
Household contact 1 0.3<br />
Other 9 3.0<br />
Undetermined 54 18.0<br />
Total 300 100.0<br />
Rate per 100,000 population<br />
160<br />
140<br />
120<br />
100<br />
80<br />
60<br />
40<br />
20<br />
0<br />
0-4<br />
5-9<br />
10-14<br />
15-19<br />
20-24<br />
25-29<br />
30-34<br />
35-39<br />
40-44<br />
45-49<br />
50-54<br />
55-59<br />
60-64<br />
Age group (years)<br />
65-69<br />
Male<br />
Female<br />
70-74<br />
75-79<br />
80-84<br />
85+<br />
* Data from the Australian Capital Territory, South<br />
Australia, Tasmania, Victoria <strong>and</strong> Western Australia<br />
only, (National Centre in HIV Epidemiology <strong>and</strong><br />
Clinical Research, 2005 2 )<br />
CDI Vol 30 No 1 2006 25


