

PDF file - Department of Health and Ageing
PDF file - Department of Health and Ageing
PDF file - Department of Health and Ageing

You also want an ePaper? Increase the reach of your titles
YUMPU automatically turns print PDFs into web optimized ePapers that Google loves.
Annual report Influenza Surveillance in Victoria, 2005<br />
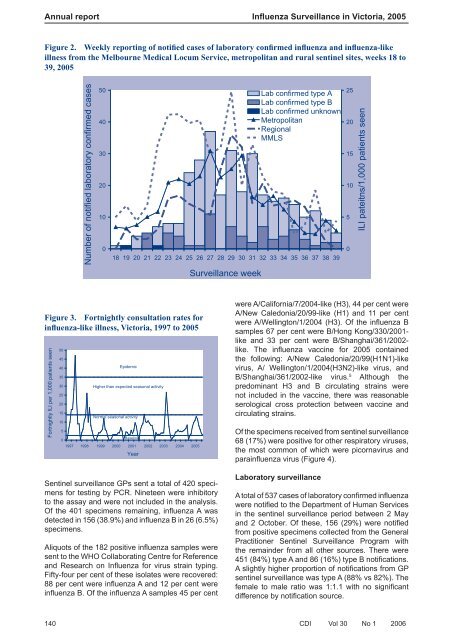
Figure 2. Weekly reporting <strong>of</strong> notified cases <strong>of</strong> laboratory confirmed influenza <strong>and</strong> influenza-like<br />
illness from the Melbourne Medical Locum Service, metropolitan <strong>and</strong> rural sentinel sites, weeks 18 to<br />
39, 2005<br />
Number <strong>of</strong> notified laboratory confirmed cases<br />
50<br />
40<br />
30<br />
20<br />
10<br />
0<br />
Lab confirmed type A<br />
Lab confirmed type B<br />
Lab confirmed unknown<br />
Metropolitan<br />
Regional<br />
MMLS<br />
18 19 20 21 22 23 24 25 26 27 28 29 30 31 32 33 34 35 36 37 38 39<br />
25<br />
20<br />
15<br />
10<br />
5<br />
0<br />
ILI pateitns/1,000 patients seen<br />
Surveillance week<br />
Figure 3. Fortnightly consultation rates for<br />
influenza-like illness, Victoria, 1997 to 2005<br />
Fortnightly ILI per 1,000 patients seen<br />
50<br />
45<br />
40<br />
35<br />
30<br />
25<br />
20<br />
15<br />
10<br />
5<br />
0<br />
Epidemic<br />
Higher than expected seasonal activity<br />
Normal seasonal activity<br />
Baseline<br />
1997 1998 1999 2000 2001 2002 2003 2004 2005<br />
Year<br />
Sentinel surveillance GPs sent a total <strong>of</strong> 420 specimens<br />
for testing by PCR. Nineteen were inhibitory<br />
to the assay <strong>and</strong> were not included in the analysis.<br />
Of the 401 specimens remaining, infl uenza A was<br />
detected in 156 (38.9%) <strong>and</strong> infl uenza B in 26 (6.5%)<br />
specimens.<br />
Aliquots <strong>of</strong> the 182 positive infl uenza samples were<br />
sent to the WHO Collaborating Centre for Reference<br />
<strong>and</strong> Research on Infl uenza for virus strain typing.<br />
Fifty-four per cent <strong>of</strong> these isolates were recovered:<br />
88 per cent were infl uenza A <strong>and</strong> 12 per cent were<br />
infl uenza B. Of the infl uenza A samples 45 per cent<br />
were A/California/7/2004-like (H3), 44 per cent were<br />
A/New Caledonia/20/99-like (H1) <strong>and</strong> 11 per cent<br />
were A/Wellington/1/2004 (H3). Of the infl uenza B<br />
samples 67 per cent were B/Hong Kong/330/2001-<br />
like <strong>and</strong> 33 per cent were B/Shanghai/361/2002-<br />
like. The infl uenza vaccine for 2005 contained<br />
the following: A/New Caledonia/20/99(H1N1)-like<br />
virus, A/ Wellington/1/2004(H3N2)-like virus, <strong>and</strong><br />
B/Shanghai/361/2002-like virus. 5 Although the<br />
predominant H3 <strong>and</strong> B circulating strains were<br />
not included in the vaccine, there was reasonable<br />
serological cross protection between vaccine <strong>and</strong><br />
circulating strains.<br />
Of the specimens received from sentinel surveillance<br />
68 (17%) were positive for other respiratory viruses,<br />
the most common <strong>of</strong> which were picornavirus <strong>and</strong><br />
parainfl uenza virus (Figure 4).<br />
Laboratory surveillance<br />
A total <strong>of</strong> 537 cases <strong>of</strong> laboratory confi rmed infl uenza<br />
were notifi ed to the <strong>Department</strong> <strong>of</strong> Human Services<br />
in the sentinel surveillance period between 2 May<br />
<strong>and</strong> 2 October. Of these, 156 (29%) were notifi ed<br />
from positive specimens collected from the General<br />
Practitioner Sentinel Surveillance Program with<br />
the remainder from all other sources. There were<br />
451 (84%) type A <strong>and</strong> 86 (16%) type B notifi cations.<br />
A slightly higher proportion <strong>of</strong> notifi cations from GP<br />
sentinel surveillance was type A (88% vs 82%). The<br />
female to male ratio was 1:1.1 with no signifi cant<br />
difference by notifi cation source.<br />
140 CDI Vol 30 No 1 2006


