

PDF file - Department of Health and Ageing
PDF file - Department of Health and Ageing
PDF file - Department of Health and Ageing

You also want an ePaper? Increase the reach of your titles
YUMPU automatically turns print PDFs into web optimized ePapers that Google loves.
National Notifiable Diseases Surveillance System, 2004<br />
Annual report<br />
In 2004, not all jurisdictions implemented the CDNA<br />
case defi nitions (Queensl<strong>and</strong> did not implement<br />
the CDNA case defi nitions in 2004 <strong>and</strong> New South<br />
Wales introduced it in August 2004). This has to be<br />
kept in mind when comparing data across time <strong>and</strong><br />
between jurisdictions.<br />
Results<br />
Summary <strong>of</strong> 2004 data<br />
There were 110,929 communicable disease notifications<br />
received by NNDSS in 2004 (Table 2).<br />
Notification rates per 100,000 population for each disease<br />
by state or territory are shown in Table 3. Trends<br />
in notifications <strong>and</strong> rates per 100,000 population for<br />
the period 2000 to 2004 are shown in Table 4.<br />
In 2004, the total number <strong>of</strong> notifi cations was the<br />
highest recorded in NNDSS since the system began<br />
in 1991. There was an increase <strong>of</strong> 4 per cent compared<br />
to the total number <strong>of</strong> notifi cations in 2003<br />
(Figure 2).<br />
Figure 2. Trends in notifications received by<br />
the National Notifiable Diseases Surveillance<br />
System, Australia, 1991 to 2004<br />
Notifications<br />
120,000<br />
100,000<br />
80,000<br />
60,000<br />
40,000<br />
20,000<br />
0<br />
1991 1992 1993 1994 1995 1996 1997 1998 1999 2000 2001 2002 2003 2004<br />
Year<br />
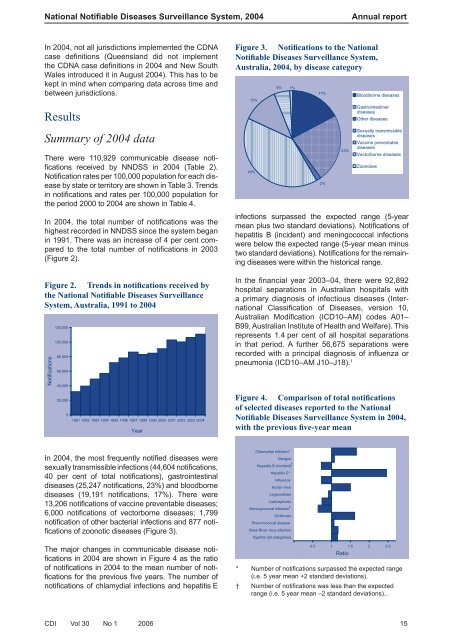
Figure 3. Notifications to the National<br />
Notifiable Diseases Surveillance System,<br />
Australia, 2004, by disease category<br />
12%<br />
40%<br />
5% 1%<br />
17%<br />
2%<br />
infections surpassed the expected range (5-year<br />
mean plus two st<strong>and</strong>ard deviations). Notifications <strong>of</strong><br />
hepatitis B (incident) <strong>and</strong> meningococcal infections<br />
were below the expected range (5-year mean minus<br />
two st<strong>and</strong>ard deviations). Notifications for the remaining<br />
diseases were within the historical range.<br />
In the fi nancial year 2003–04, there were 92,892<br />
hospital separations in Australian hospitals with<br />
a primary diagnosis <strong>of</strong> infectious diseases (International<br />
Classifi cation <strong>of</strong> Diseases, version 10,<br />
Australian Modifi cation (ICD10–AM) codes A01–<br />
B99, Aust ralian Institute <strong>of</strong> <strong>Health</strong> <strong>and</strong> Welfare). This<br />
represents 1.4 per cent <strong>of</strong> all hospital separations<br />
in that period. A further 56,675 separations were<br />
recorded with a principal diagnosis <strong>of</strong> infl uenza or<br />
pneumonia (ICD10–AM J10–J18). 1<br />
23%<br />
Bloodborne diseases<br />
Gastrointestinal<br />
diseases<br />
Other diseases<br />
Sexually transmissible<br />
diseases<br />
Vaccine preventable<br />
diseases<br />
Vectorborne diseases<br />
Zoonoses<br />
Figure 4. Comparison <strong>of</strong> total notifications<br />
<strong>of</strong> selected diseases reported to the National<br />
Notifiable Diseases Surveillance System in 2004,<br />
with the previous five-year mean<br />
In 2004, the most frequently notified diseases were<br />
sexually transmissible infections (44,604 notifications,<br />
40 per cent <strong>of</strong> total notifications), gastrointestinal<br />
diseases (25,247 notifications, 23%) <strong>and</strong> bloodborne<br />
diseases (19,191 notifications, 17%). There were<br />
13,206 notifications <strong>of</strong> vaccine preventable diseases;<br />
6,000 notifications <strong>of</strong> vectorborne diseases; 1,799<br />
notification <strong>of</strong> other bacterial infections <strong>and</strong> 877 notifications<br />
<strong>of</strong> zoonotic diseases (Figure 3).<br />
The major changes in communicable disease notifications<br />
in 2004 are shown in Figure 4 as the ratio<br />
<strong>of</strong> notifications in 2004 to the mean number <strong>of</strong> notifications<br />
for the previous five years. The number <strong>of</strong><br />
notifications <strong>of</strong> chlamydial infections <strong>and</strong> hepatitis E<br />
Chlamydial infection*<br />
Dengue<br />
Hepatitis B (incident) †<br />
Hepatitis E*<br />
Influenza<br />
Kunjin virus<br />
Legionellosis<br />
Leptospirosis<br />
Meningococcal infection †<br />
Ornithosis<br />
Pneumococcal disease<br />
Ross River virus infection<br />
Syphilis (all categories)<br />
0.5 1 1.5 2 2.5<br />
Ratio<br />
* Number <strong>of</strong> notifi cations surpassed the expected range<br />
(i.e. 5 year mean +2 st<strong>and</strong>ard deviations).<br />
† Number <strong>of</strong> notifi cations was less than the expected<br />
range (i.e. 5 year mean –2 st<strong>and</strong>ard deviations)..<br />
CDI Vol 30 No 1 2006 15


